![]()
Console
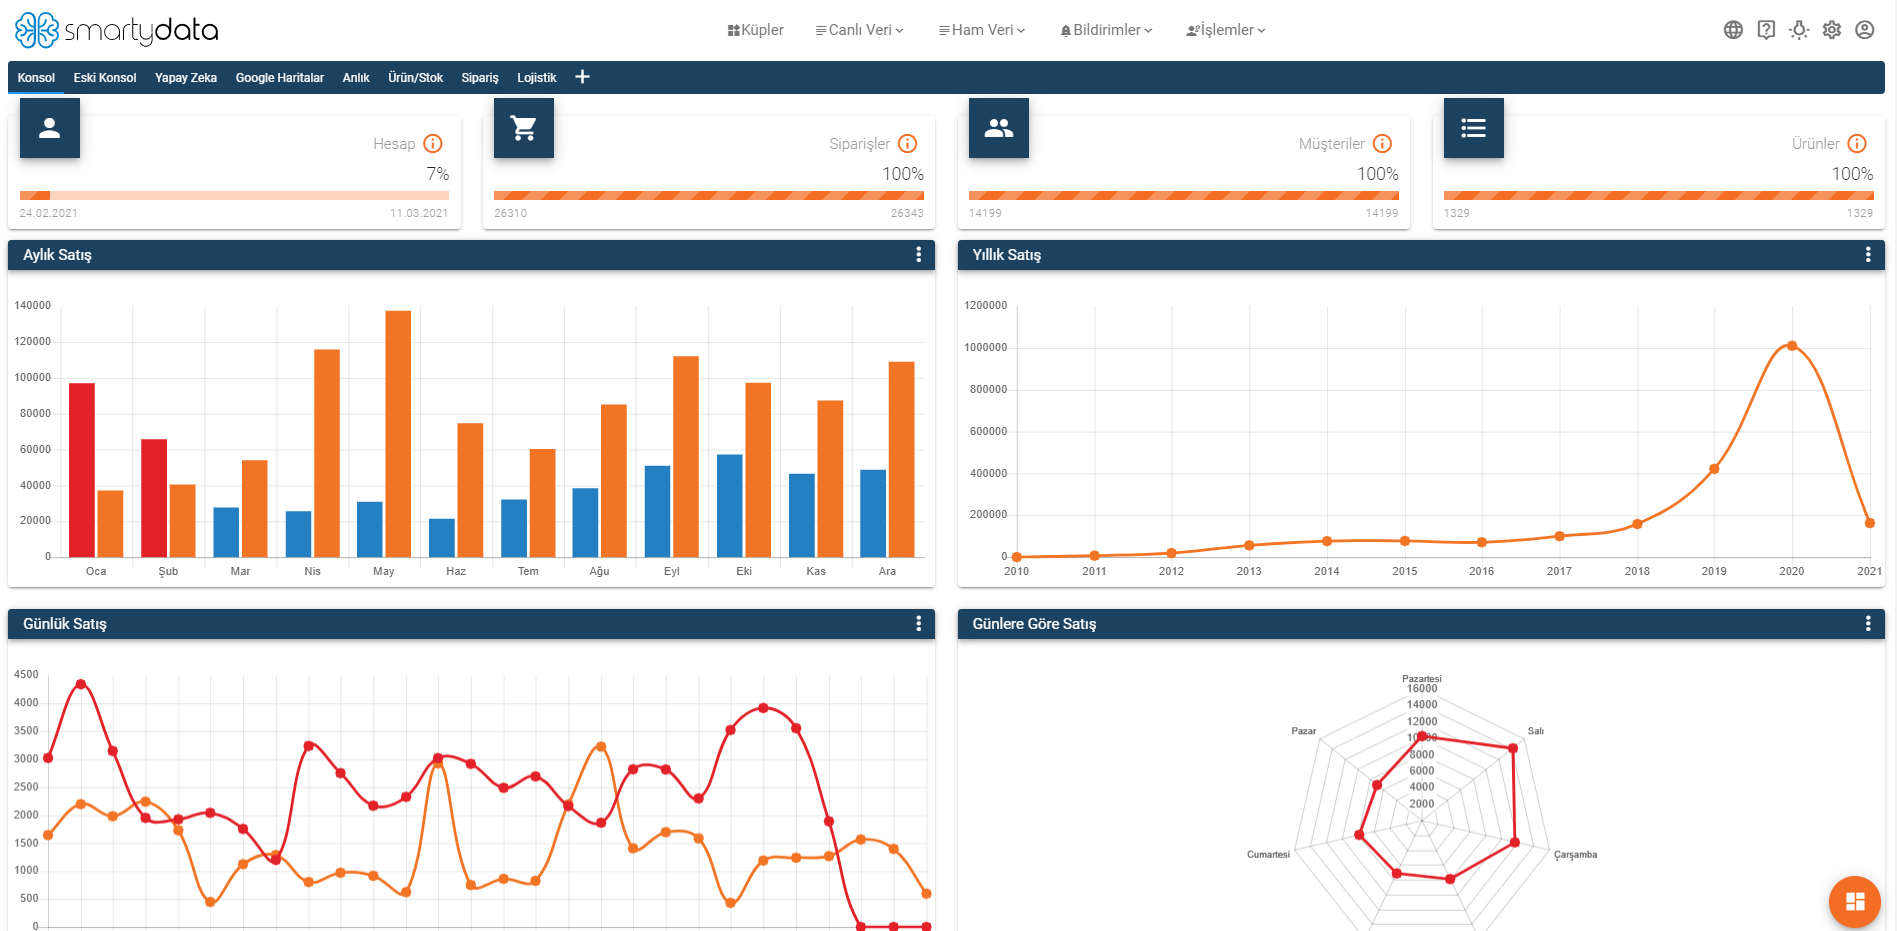
The console is where you can find daily, monthly, and yearly sales, delivery and shipment times, overall trends, cube trends, your top products, and regional maps.
To filter your console charts, click the filter icon located at the top left corner of each chart;
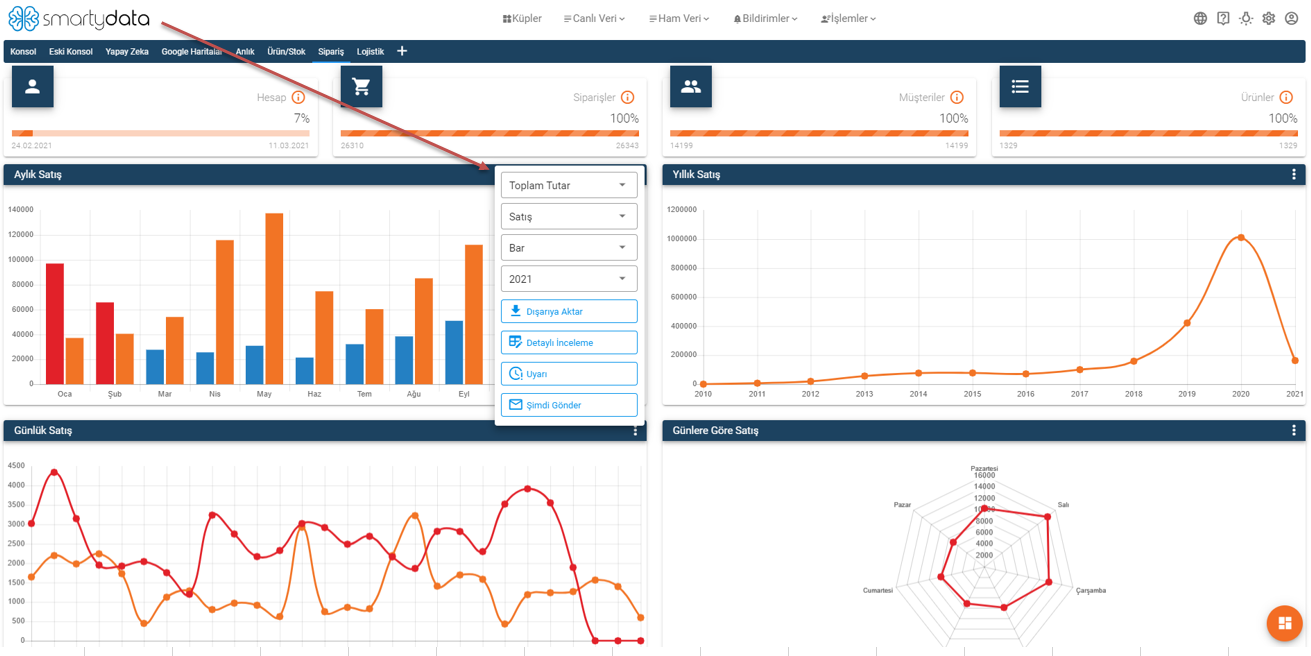
A filter section like this will appear. From here, select the type of metric you want to see in the first box. In the second box, choose one of the options: Sale, Cancel, or Return, then select your chart type in the third box. Finally, apply the date filter in the last box to generate the desired chart.
Export button allows you to export your work as a CSV file.
Detailed View button lets you examine your chart in more detail.
Alert button enables you to create alerts based on specified values in your chart. When your chart reaches these values, you will receive alert emails to keep you informed about real-time developments.
Send Now button allows you to share your chart with others.
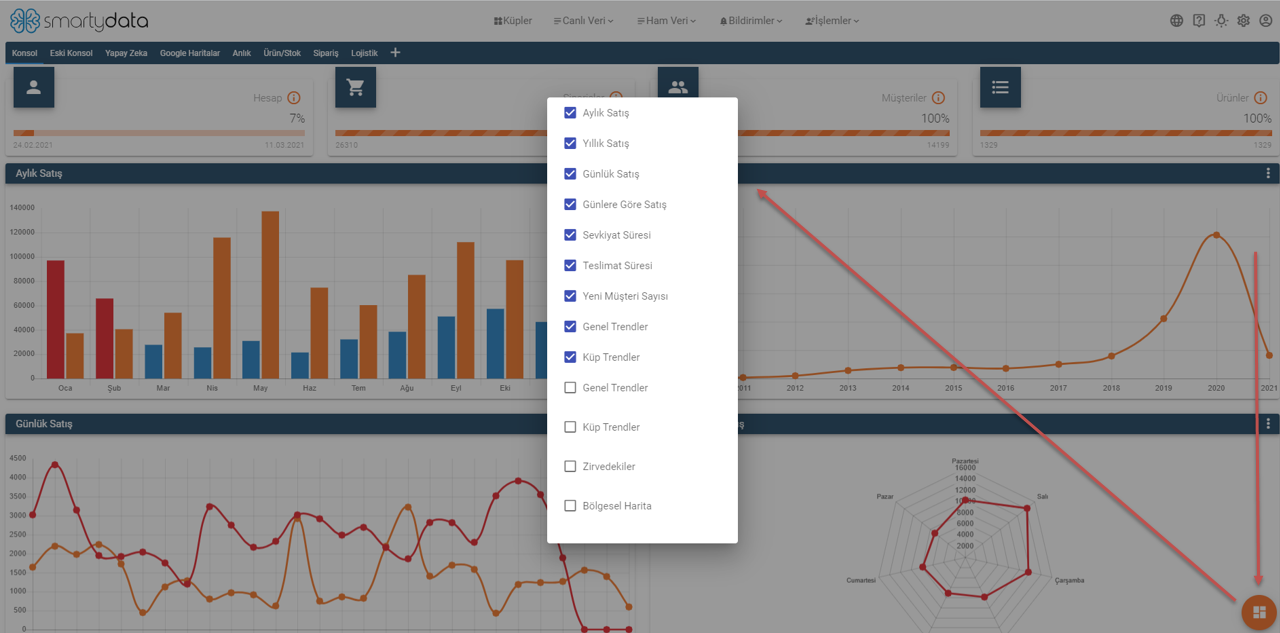
The icon located at the bottom right corner shows the charts available on the console screen. Using this icon, you can hide unwanted charts from your console or bring back hidden charts to the console screen.
Detailed View
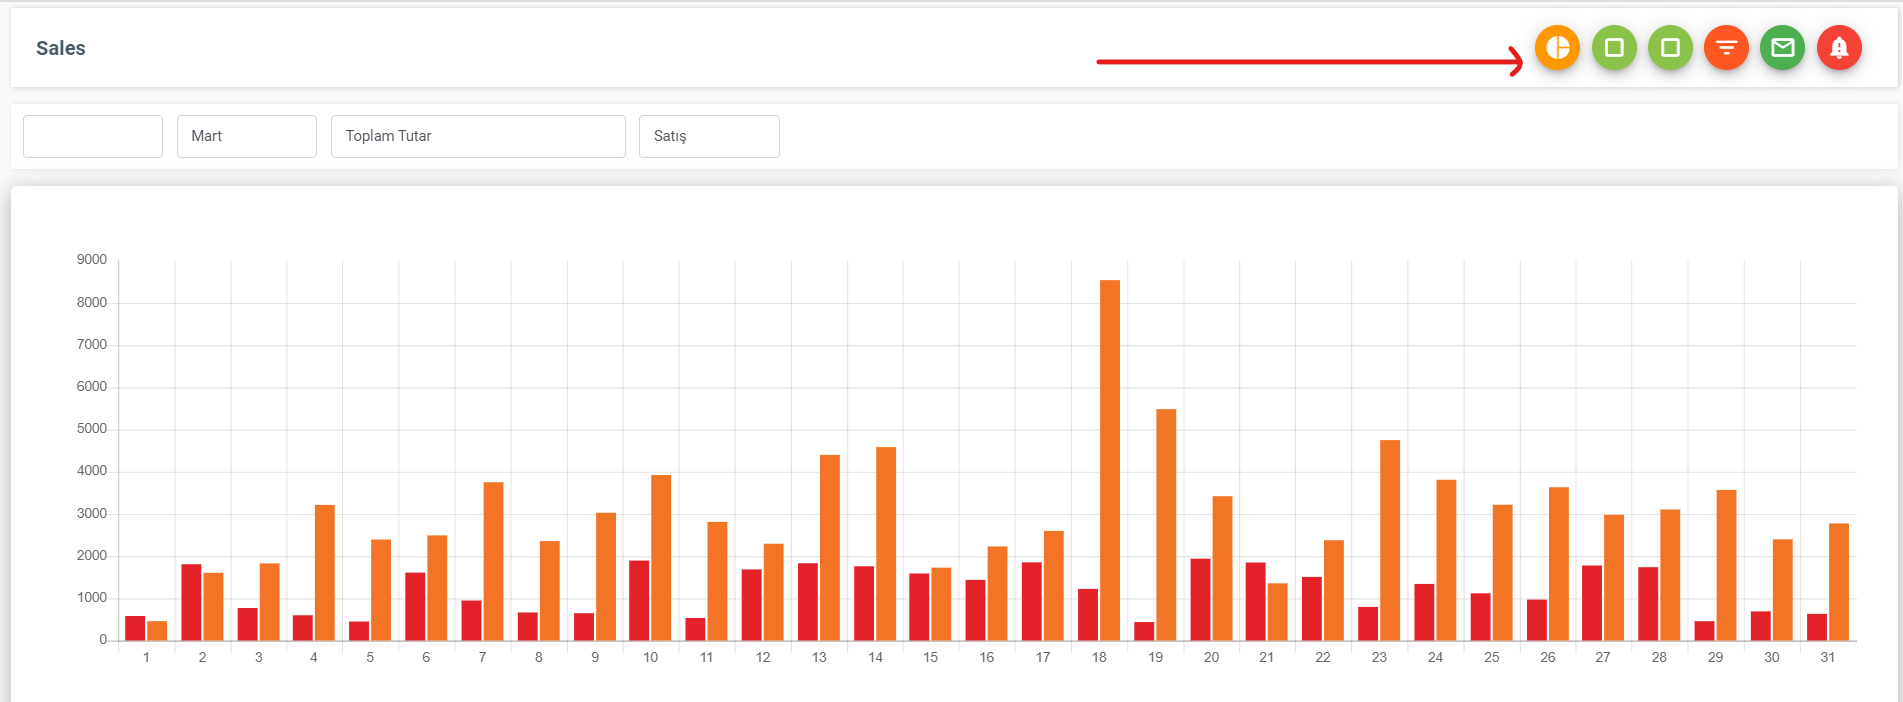
With the detailed view page, you can dive deeper into the charts available on the console,
Change the chart type, switch to live data and pivot tables to deepen your analysis,
Use the filter button to apply filters to your chart, send your chart via email to desired recipients,
Create alerts when any anomalies occur on the chart.
You can view your chart in table format and apply filters.