![]()
Overview of SmartyData
SmartyData is an e-commerce data analysis software developed by prioritizing e-commerce needs, utilizing business intelligence and data mining. With SmartyData, you can consolidate all your data, explore it without limits, connect to hundreds of sources, prepare data easily, and create powerful reports within minutes.
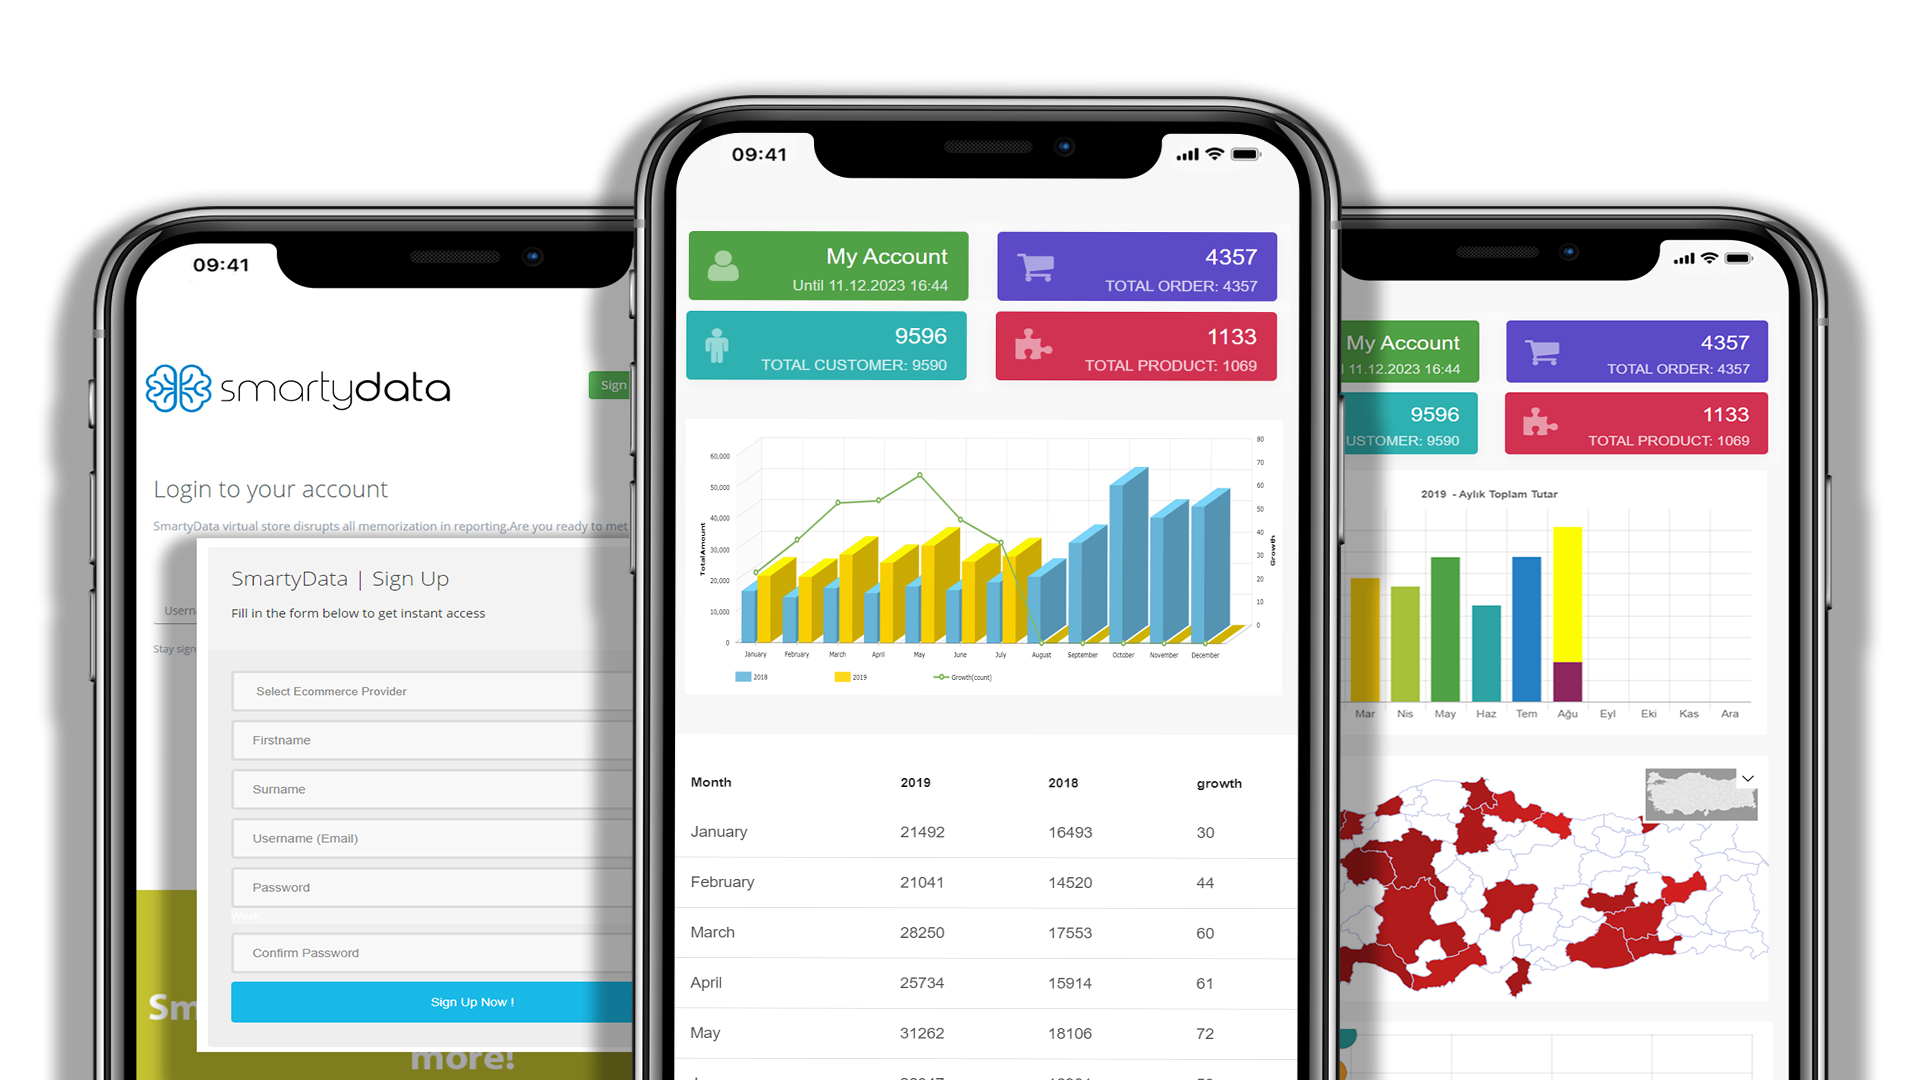
Its easy and fast usability along with responsive design for all devices enables you to access your reports anytime, anywhere from any device.
With action notifications, you receive alerts when data changes and can review reports in detail.
You can quickly explore your data using search or filtering options. SmartyData visualizes data quickly and securely, offering efficient workflows that enable data-driven decision making.
You can create analyses as you wish, move and arrange them freely, and adjust the size or layout of the tiles. Overall, SmartyData allows you to connect to your data regardless of location, receive up-to-date real-time information, and apply filters as needed.
Building Blocks of SmartyData
SmartyData is divided into fundamental building blocks. Thanks to these building blocks, complex processes become easy to understand, and combined they deliver meaningful results.
- Visualizations
- Data Community
- Cards
- Dashboards
Visualizations
Visualizations enable the creation of diverse charts and tables with different colors and styles. They transform complex data into understandable and meaningful information. SmartyData processes the raw data from your online store and presents the processed data through pivot tables and visual charts.
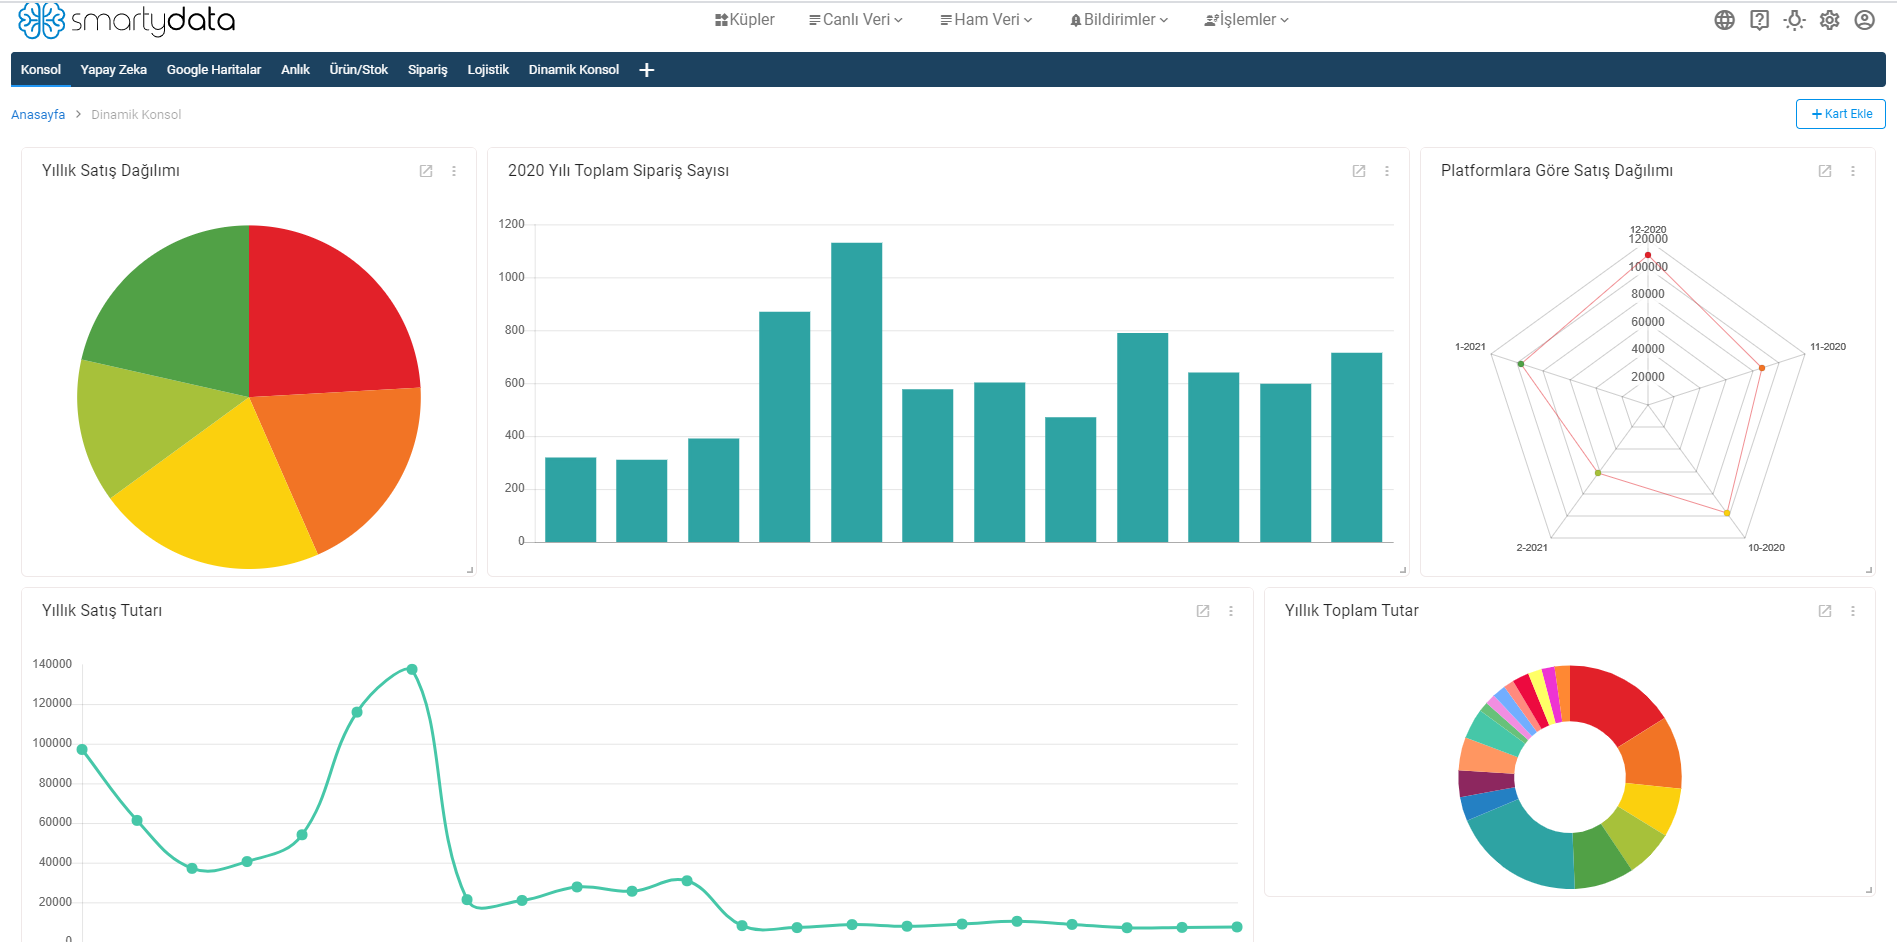
With visual charts, you can identify standout details or areas that need improvement. Thanks to OLAP cubes, you can easily generate reports of related units. You can create hundreds of reports within seconds.
Data Community
Your large and complex datasets can be processed within seconds using OLAP cubes. This saves time and allows you to shape your data by selecting the desired measures and dimensions.
Cards
Cards are rectangular boxes containing different visuals such as charts or panels. You can move and arrange these cards freely, resize or rearrange them as you wish. You can modify the filters on your cards and update them whenever you like.
Dashboards
Dashboards are areas where your created charts are displayed. You can create multiple dashboards and personalize them according to your needs.