![]()
Console Creation
Console creation sets up a screen where you can view the charts you prepare.
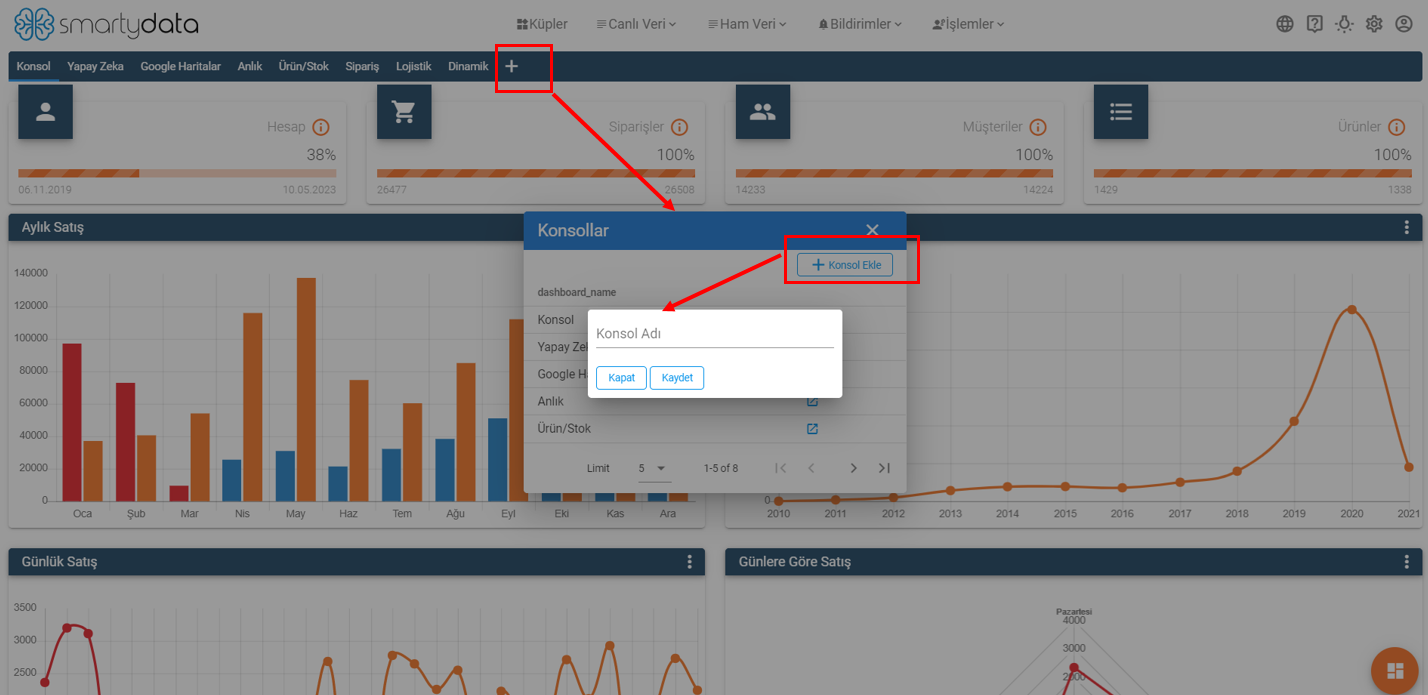
After clicking the plus button, click the add console button on the screen that appears, enter a console name, and save it.
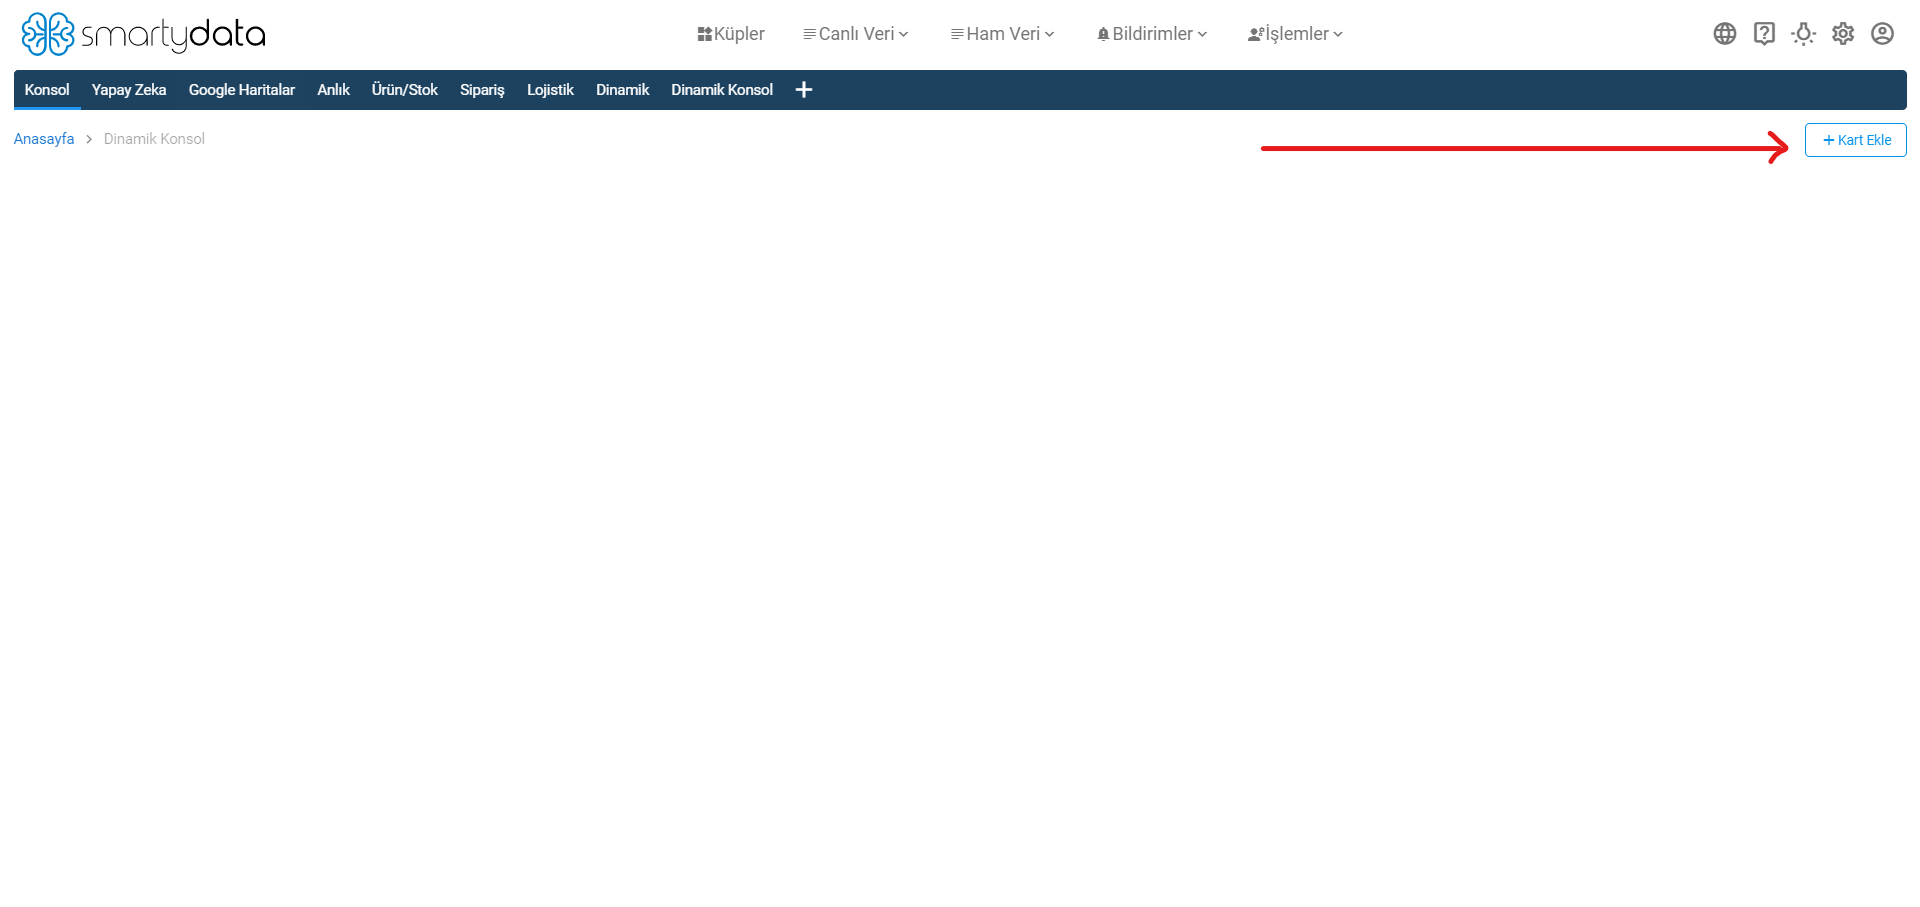
Console Screen
The console screen is where you can view the charts you have created.
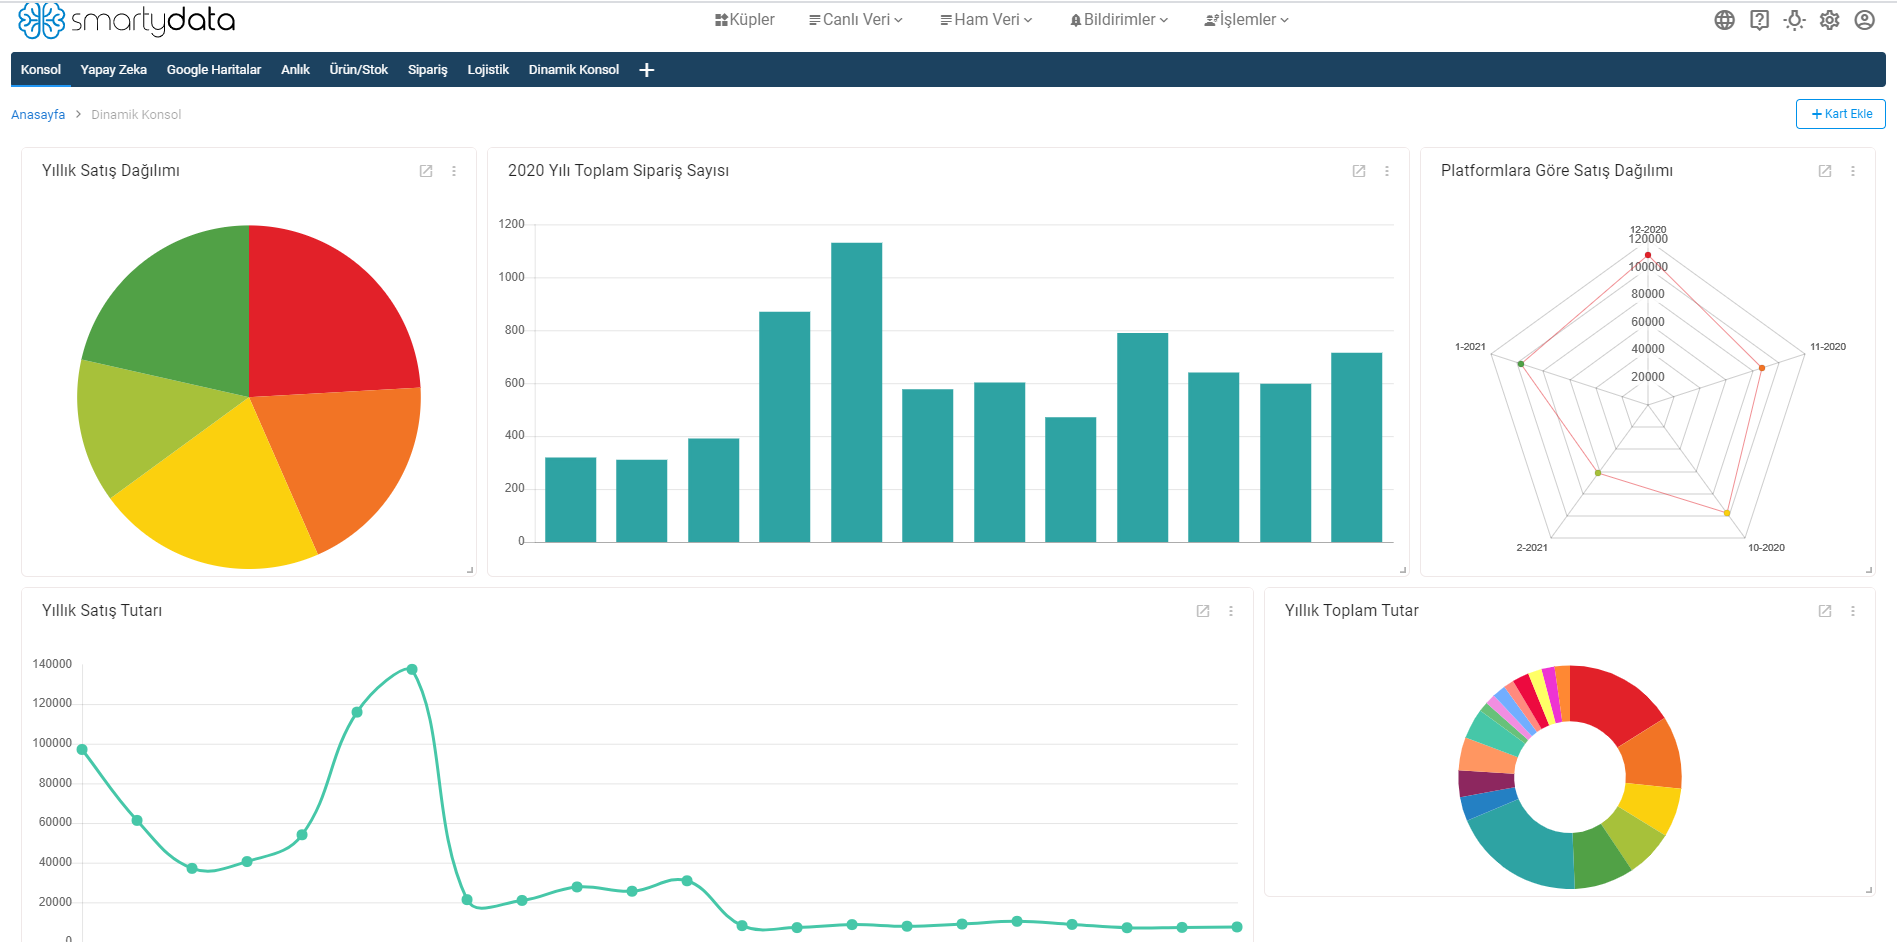
Click the add card button to create a new card.
Card Creation
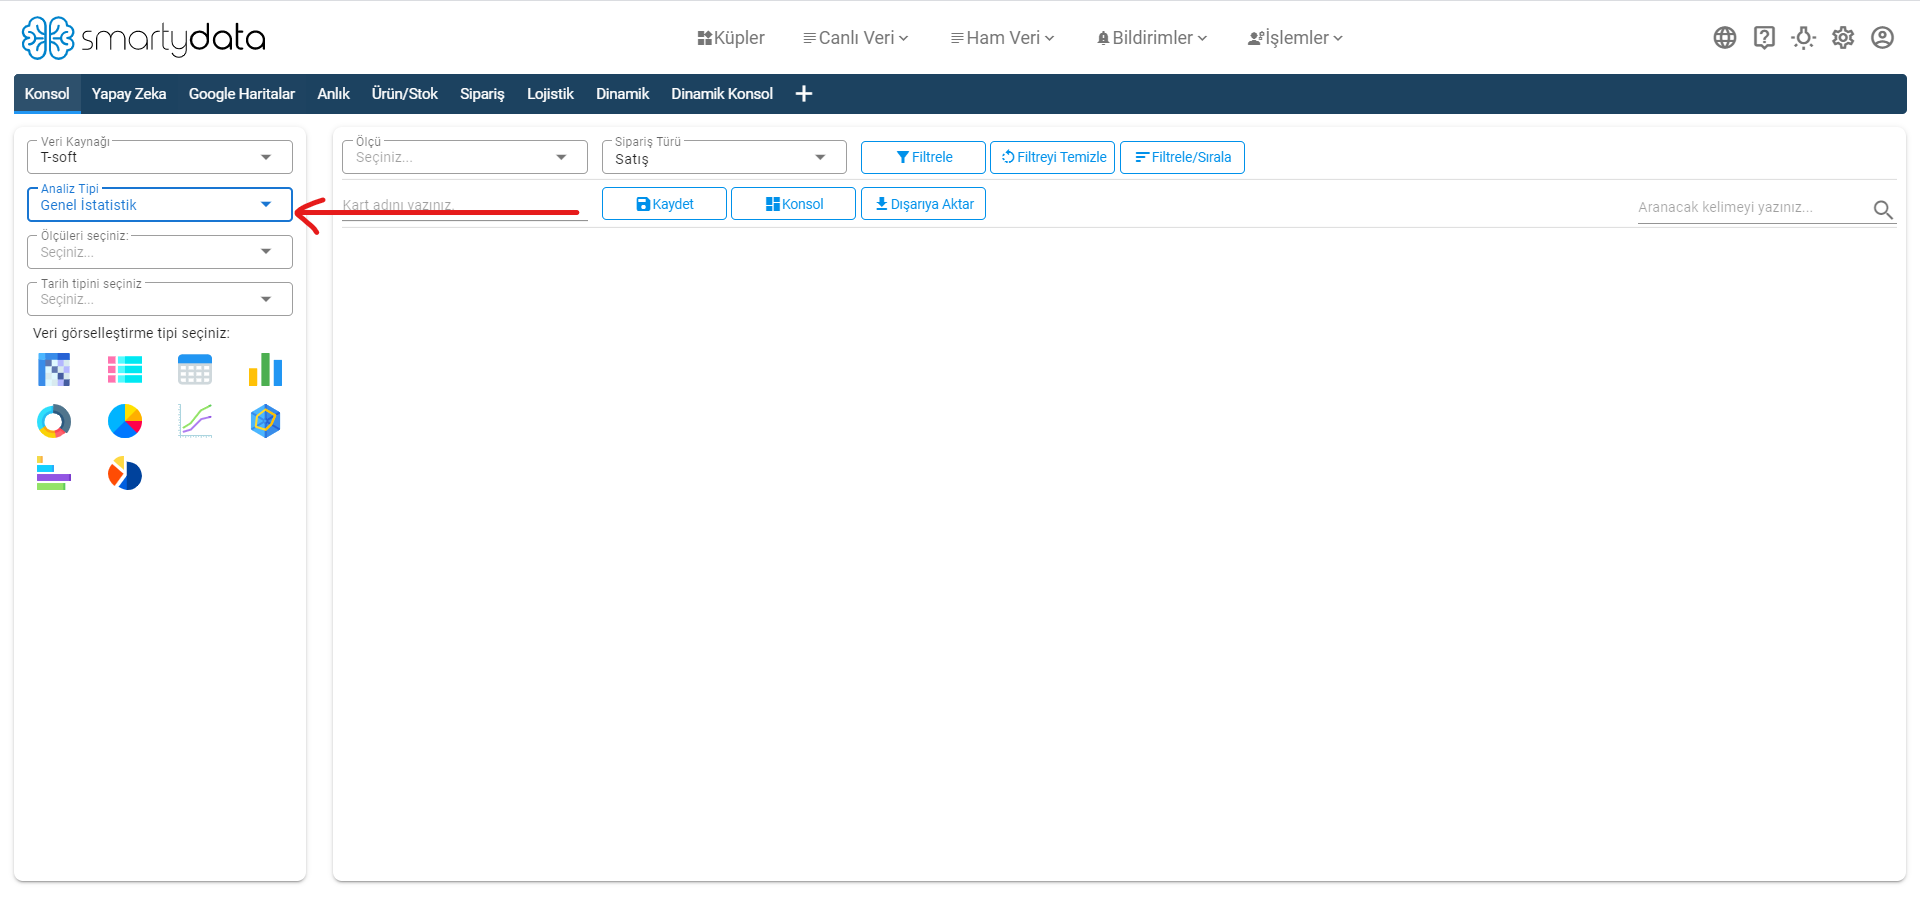
When the card creation screen opens, it will initially look like this. Filter fields will appear after you make selections in order.
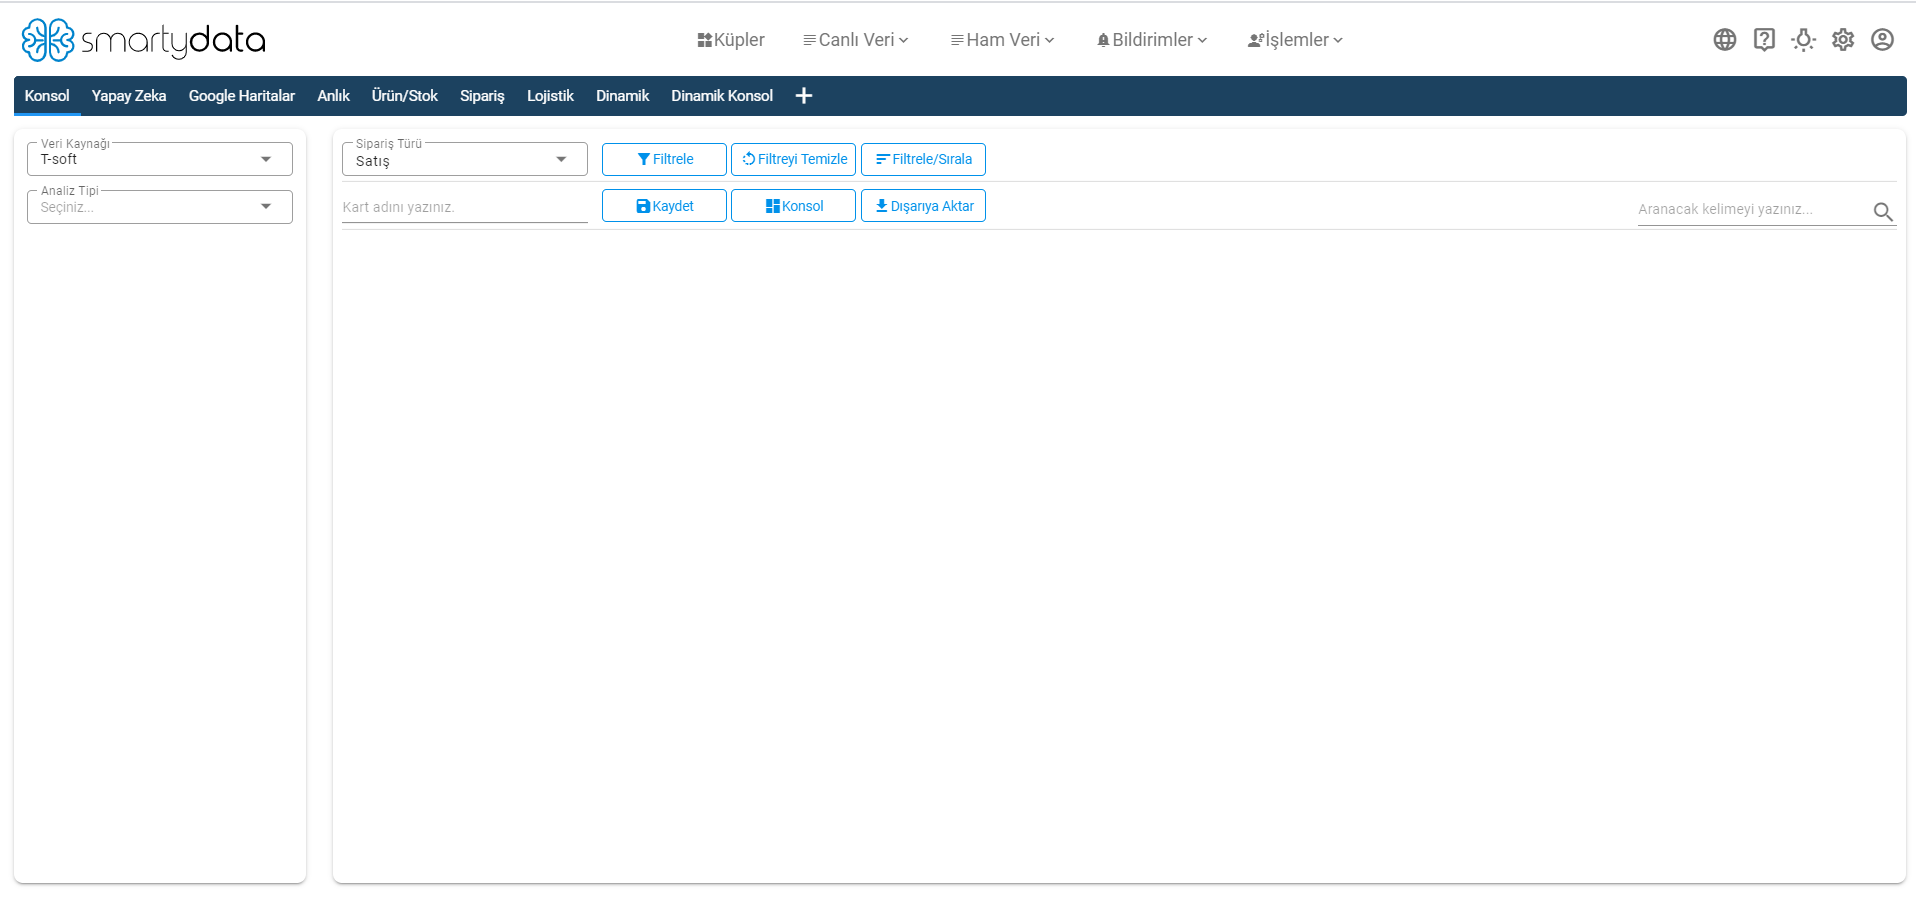
Depending on the selected analysis type, measure and dimension filters will be displayed in the filtering area. Unless these fields are selected, the next filtering area will not appear.
Select the dimension and measure fields and then choose the date type.
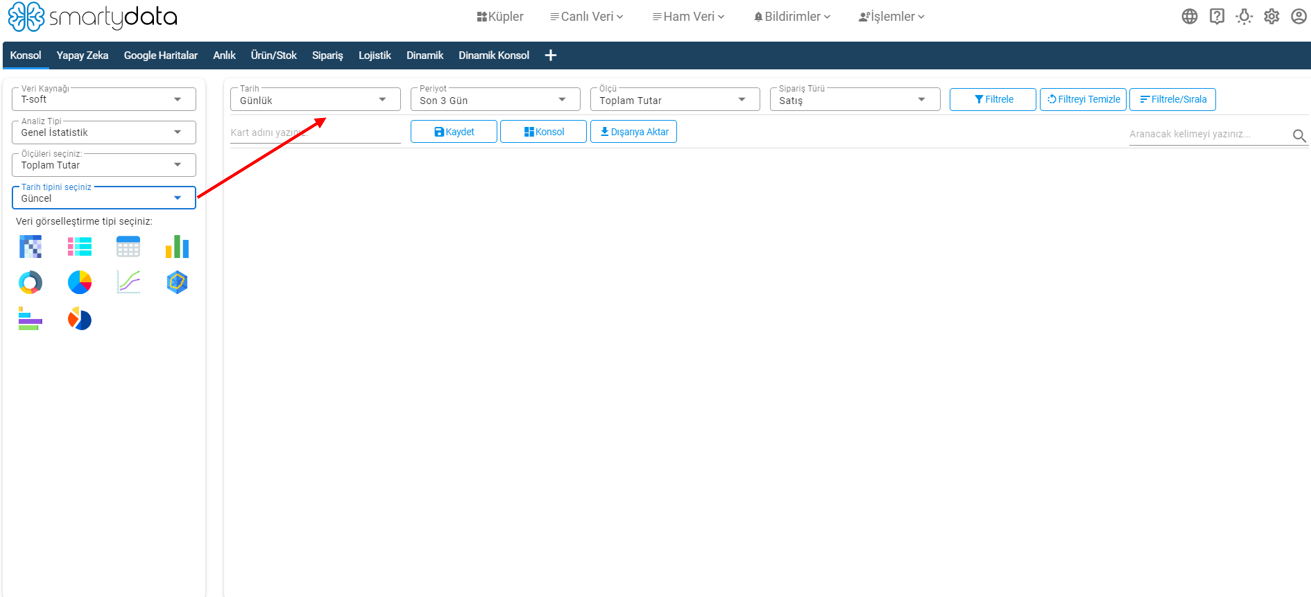
Based on the selected date type, a more detailed date filtering field will appear in the second filtering area. After completing all selections, you can choose the data visualization type and apply the filter.
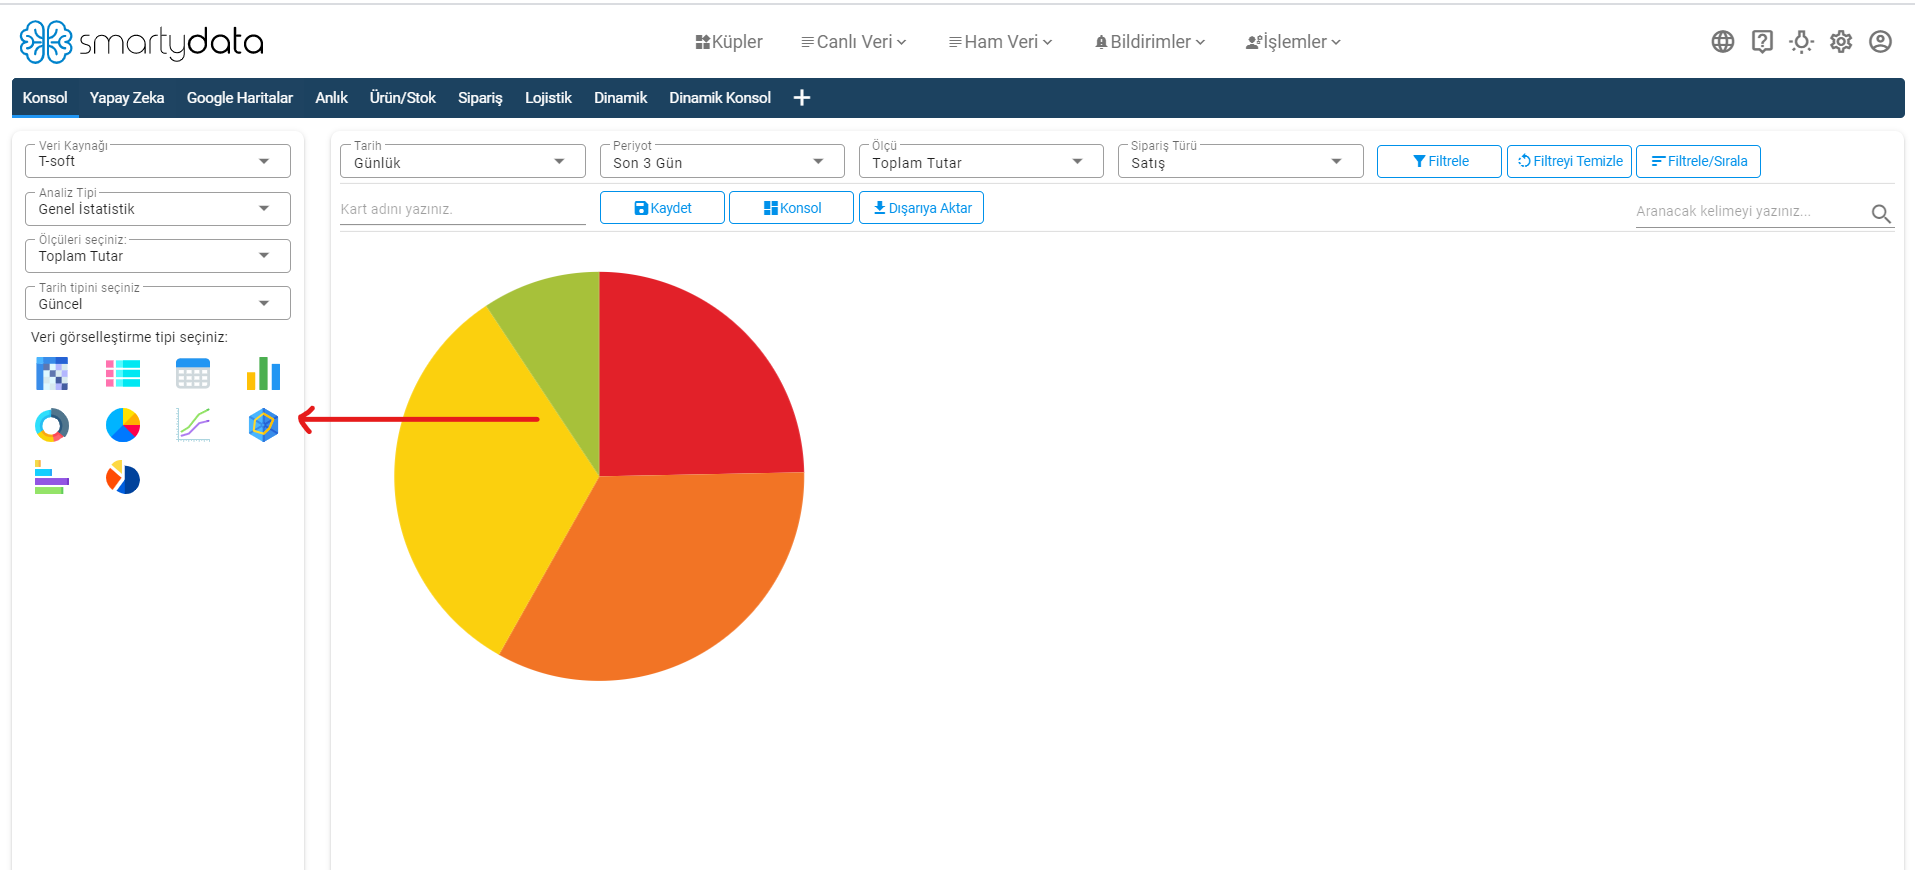
The data visualization area allows you to diversify your charts.
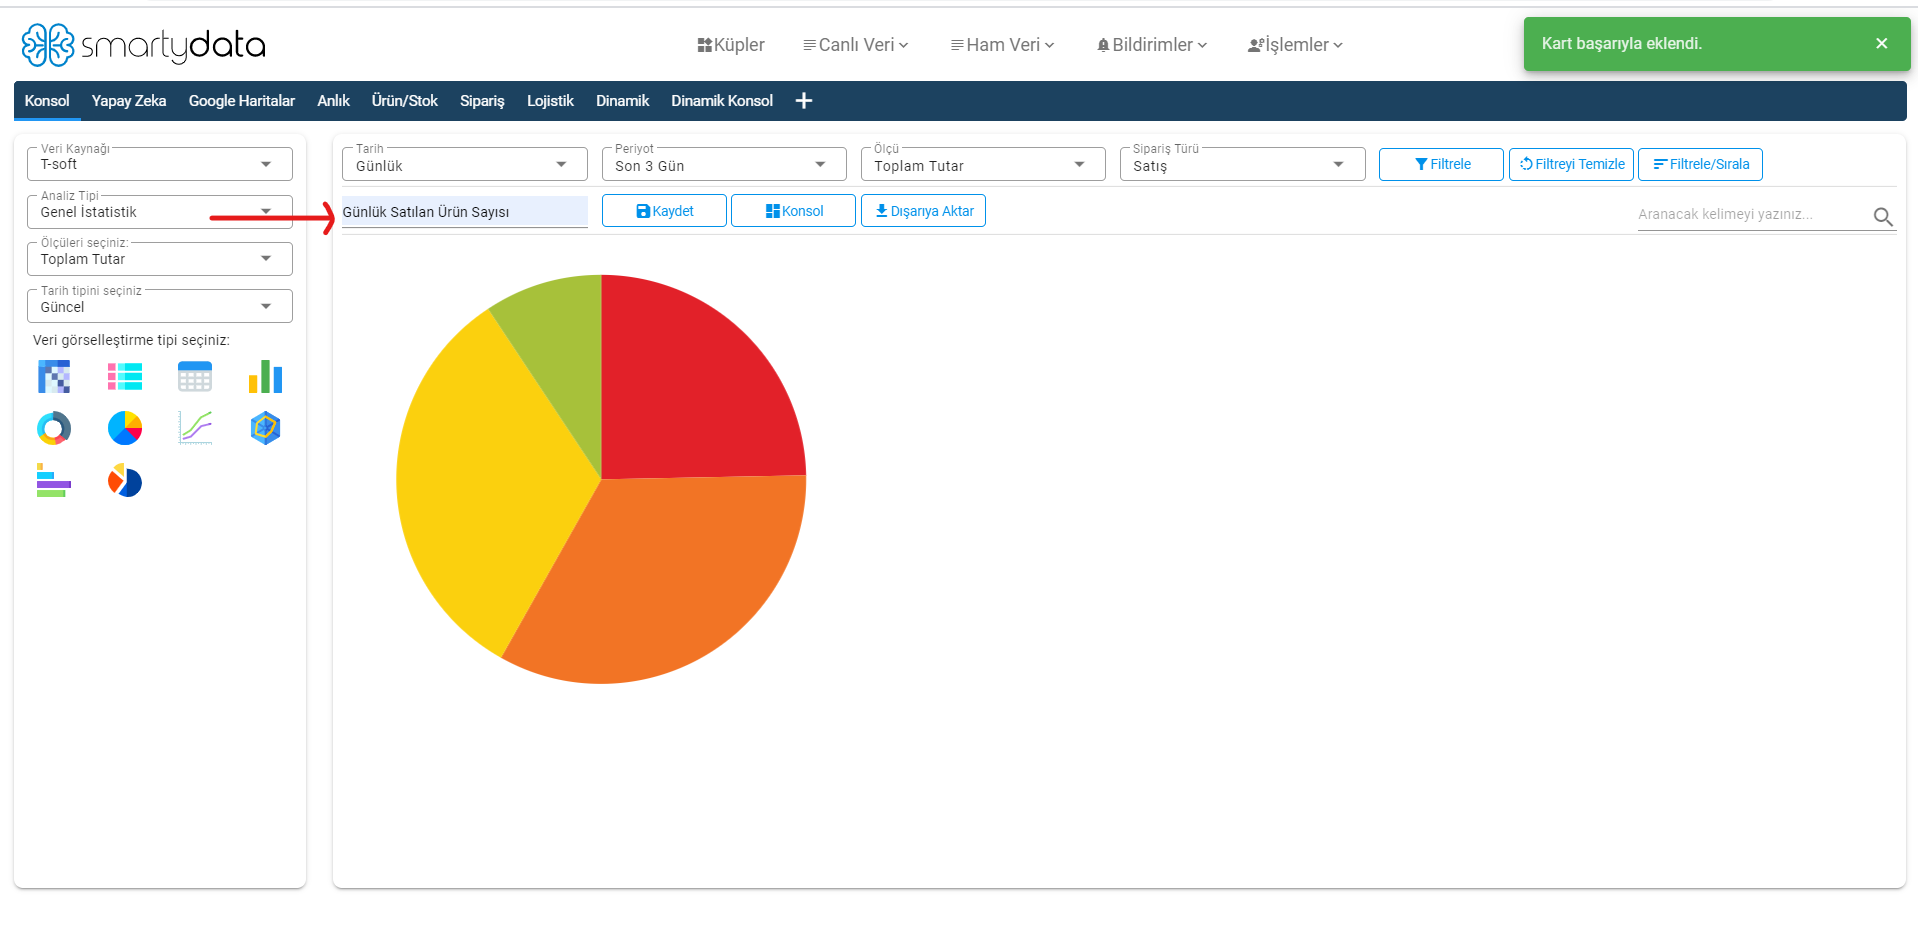
Once you name and save your chart, it will be successfully added to your console.
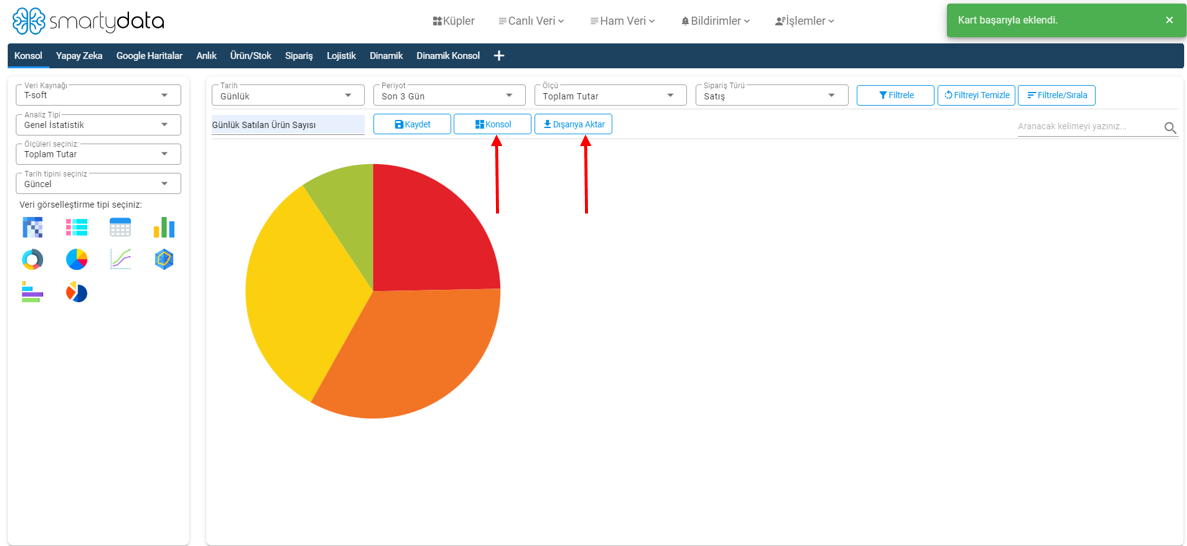
Console button navigates to the console screen.
Export allows you to export your data in CSV format.
Filter/Sort button enables you to filter and sort your chart to display only the desired values.
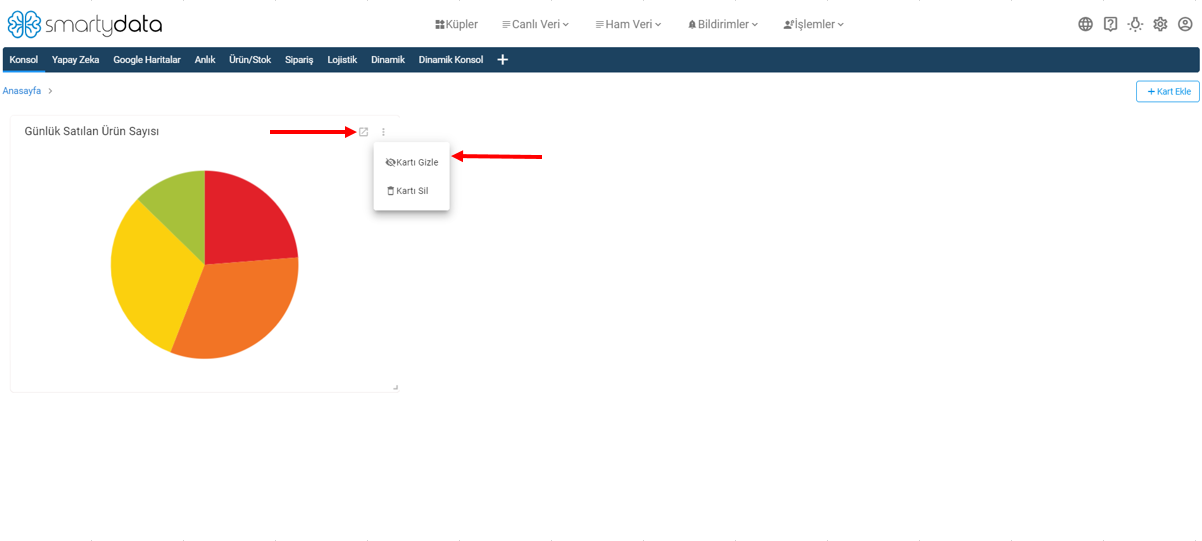
On the console screen, you can go to the editing screen from a chart, hide or delete the chart.
Card Editing Screen
This is the screen where you can filter and edit your cards by date and order type.
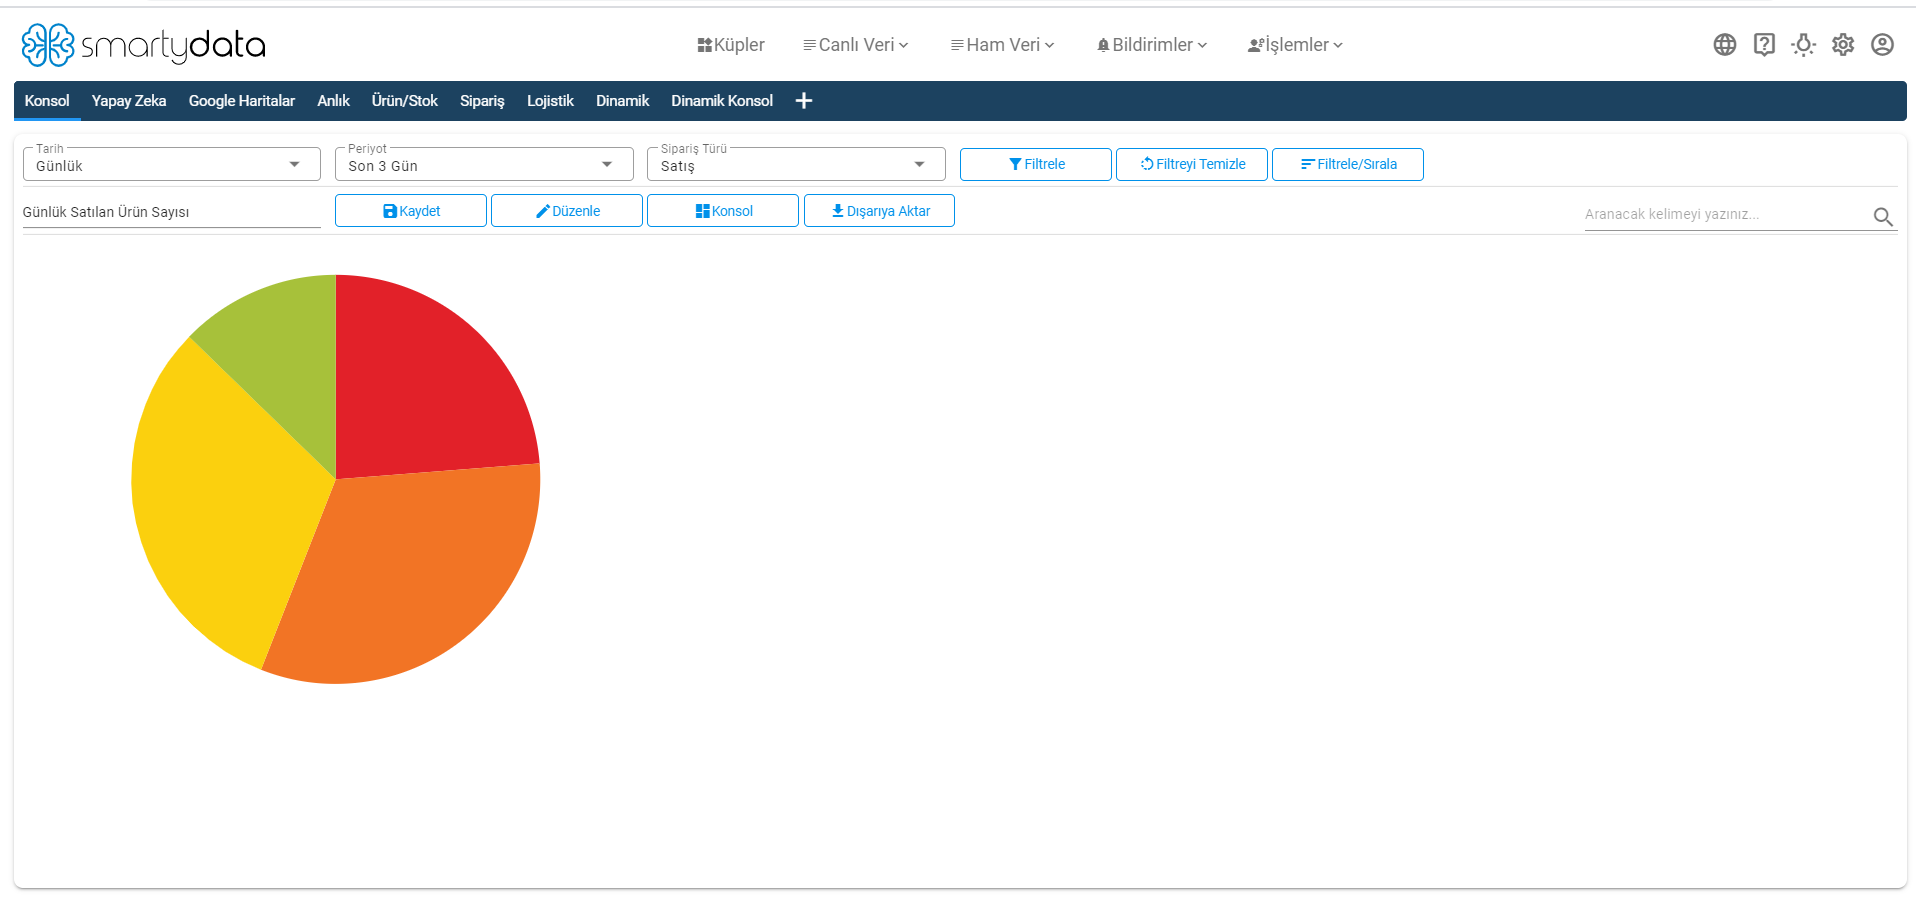
Order Type: You can select the order type as sale, cancellation, or return based on the order type filtering.
Date Range: This is the area where you change the date filtering.
With the console button, you can go to the console screen; with the edit button, you can go to the card creation screen to make more detailed filtering and modify your chart.