![]()
Live Data
Live Data allows you to view your raw data by category and product, both instantly and over a selected time period, enabling you to compare data based on dates.
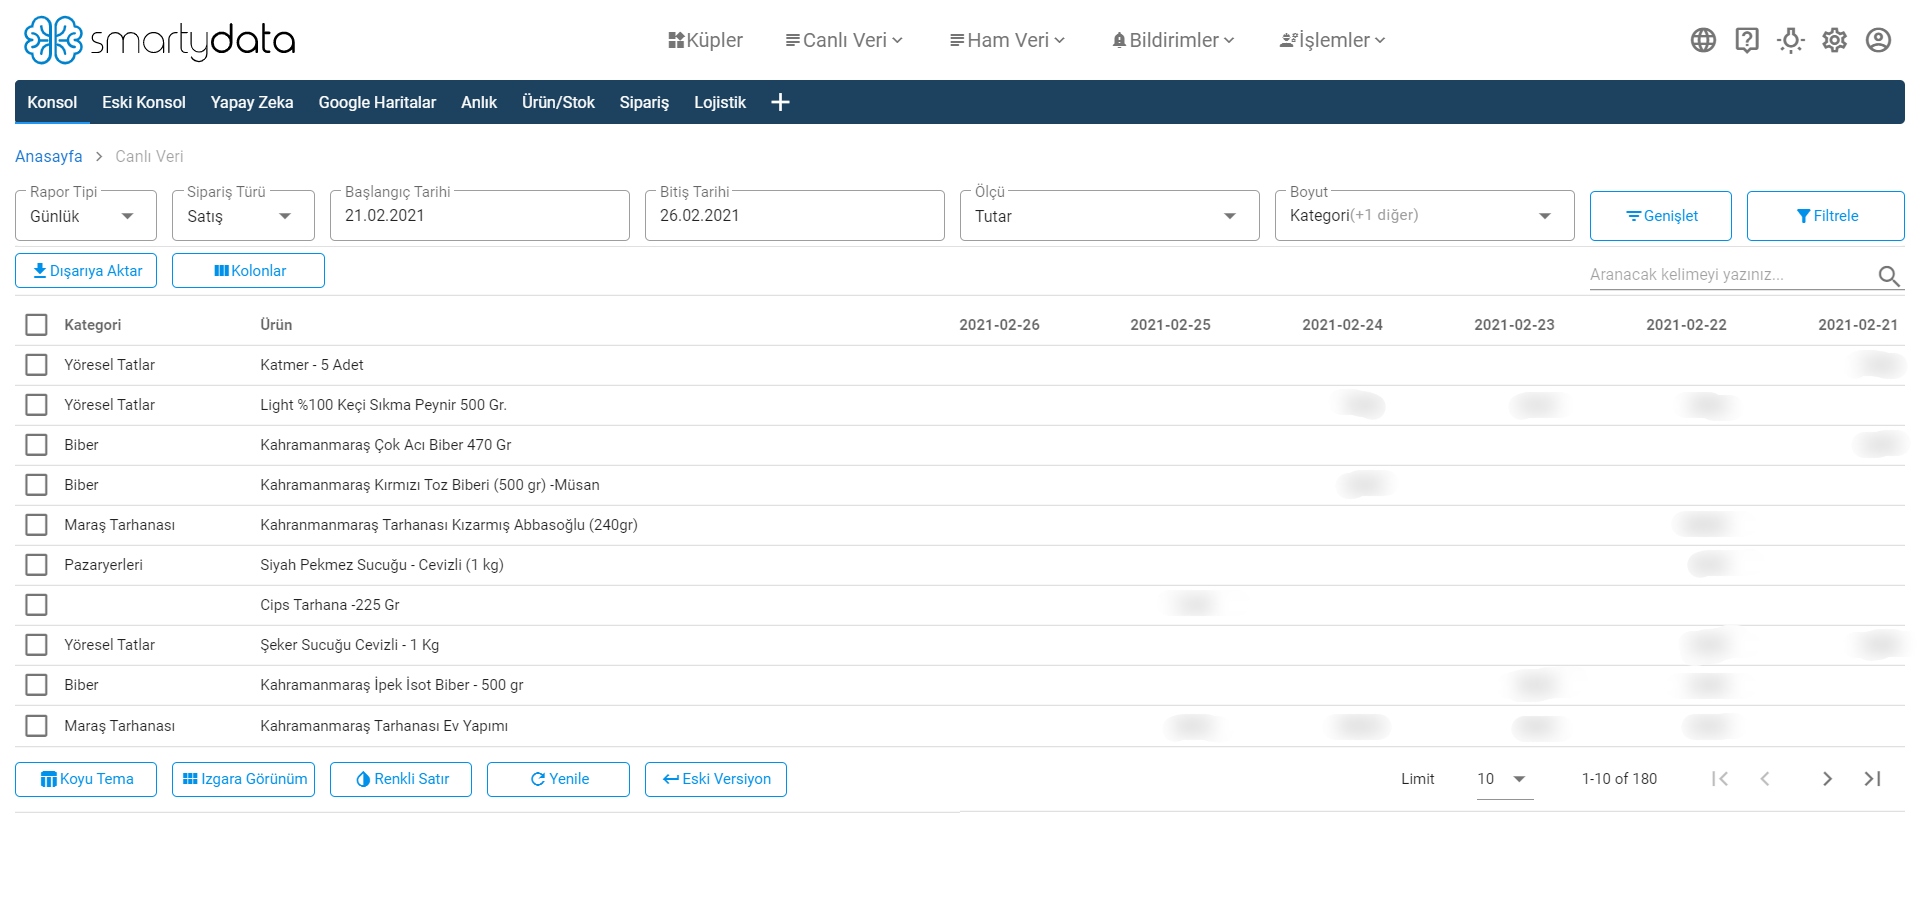
Report Type: Allows you to filter your reports instantly or weekly.
Order Type: You can select your order type as sales, cancellations, or returns according to the order type filter.
Measure: Allows you to select the criteria you want to calculate.
Dimension: Allows you to select the dimension you want to calculate.
Expand: The Expand button lets you view filters from category raw data, product raw data, and cubes.
Category Raw Data: Retrieves raw data for categories to provide a more detailed view of your categories.
Product Raw Data: Retrieves raw data for products to provide a more detailed view of your products.
Get From Cubes: The filter allows you to get your data from last month, two months ago, or the same month last year.
Clear Filters: Clears all filters applied on the page, resetting it to its initial state.
Columns: You can show or hide fields you want to see in the headers using columns.
Live Data 2
Live Data 2 allows you to filter and view values for your brands based on the dimensions selected per platform.
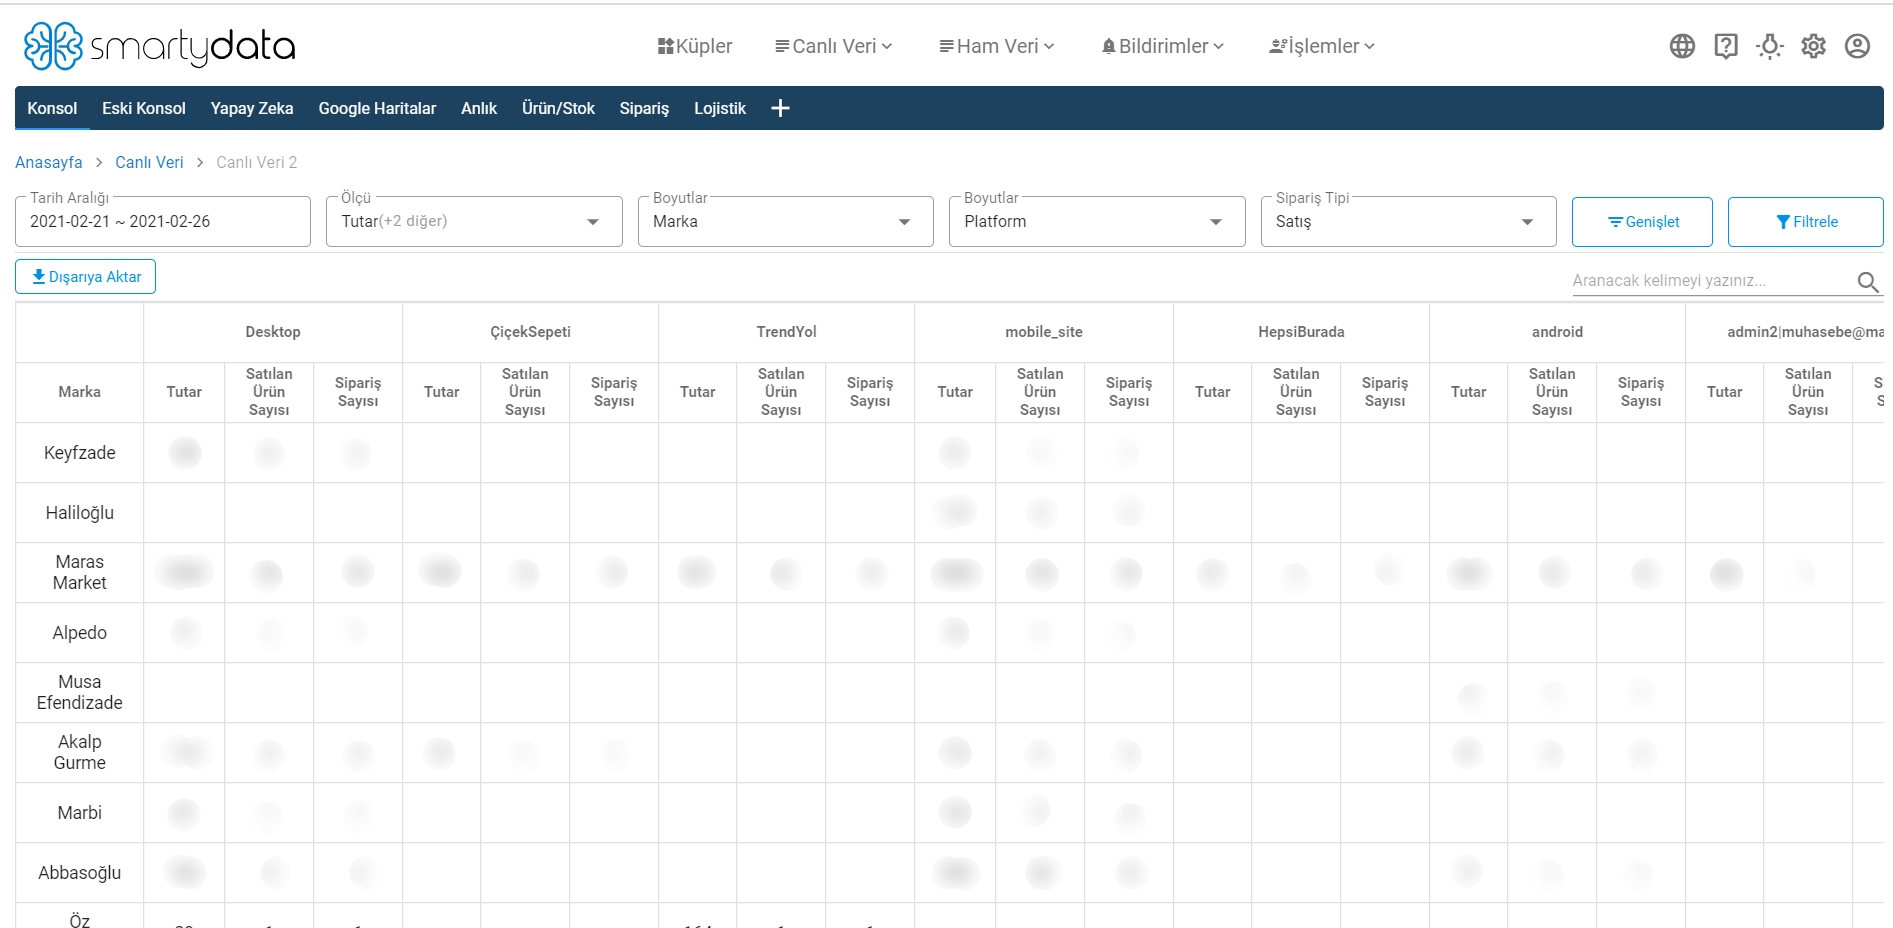
Date Range: Allows you to select the date filter range.
Measure: Allows you to select the criteria you want to calculate.
Dimension: Allows you to select the dimension you want to calculate.
Order Type: You can select your order type as sales, cancellations, or returns according to the order type filter.
Expand: The Expand button lets you view filters from category raw data, product raw data, and cubes.
Selection: Allows you to make a further selection based on the dimension you chose.
Clear Filters: Clears all filters applied on the page, resetting it to its initial state.
Export: Allows you to export data according to selected filters as a CSV file.
Live Data 3
The Live Data 3 page allows you to generate output according to the date range, measure, and dimension you specify.
Date Range: Allows you to filter data daily or weekly.
Measure: Allows you to select the criteria you want to calculate.
Order Type: You can select your order type as sales, cancellations, or returns according to the order type filter.
Clear Filters: Clears all filters applied on the page, resetting it to its initial state.
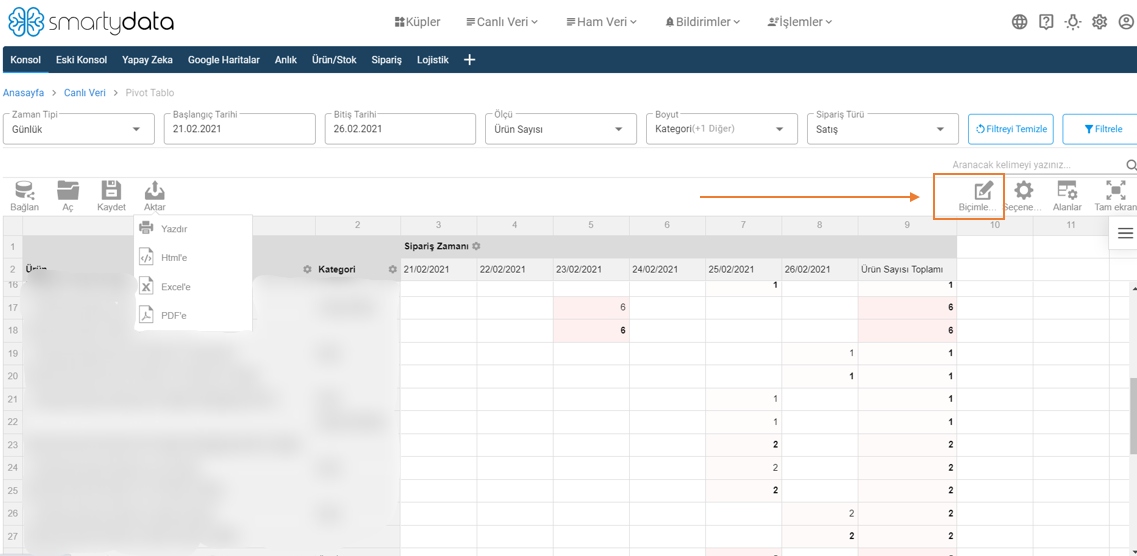
Pivot Table
Pivot Table is used to analyze, summarize, and report the records in a data list. It allows you to select multiple measures and dimensions, helping you create extensive tabulations.
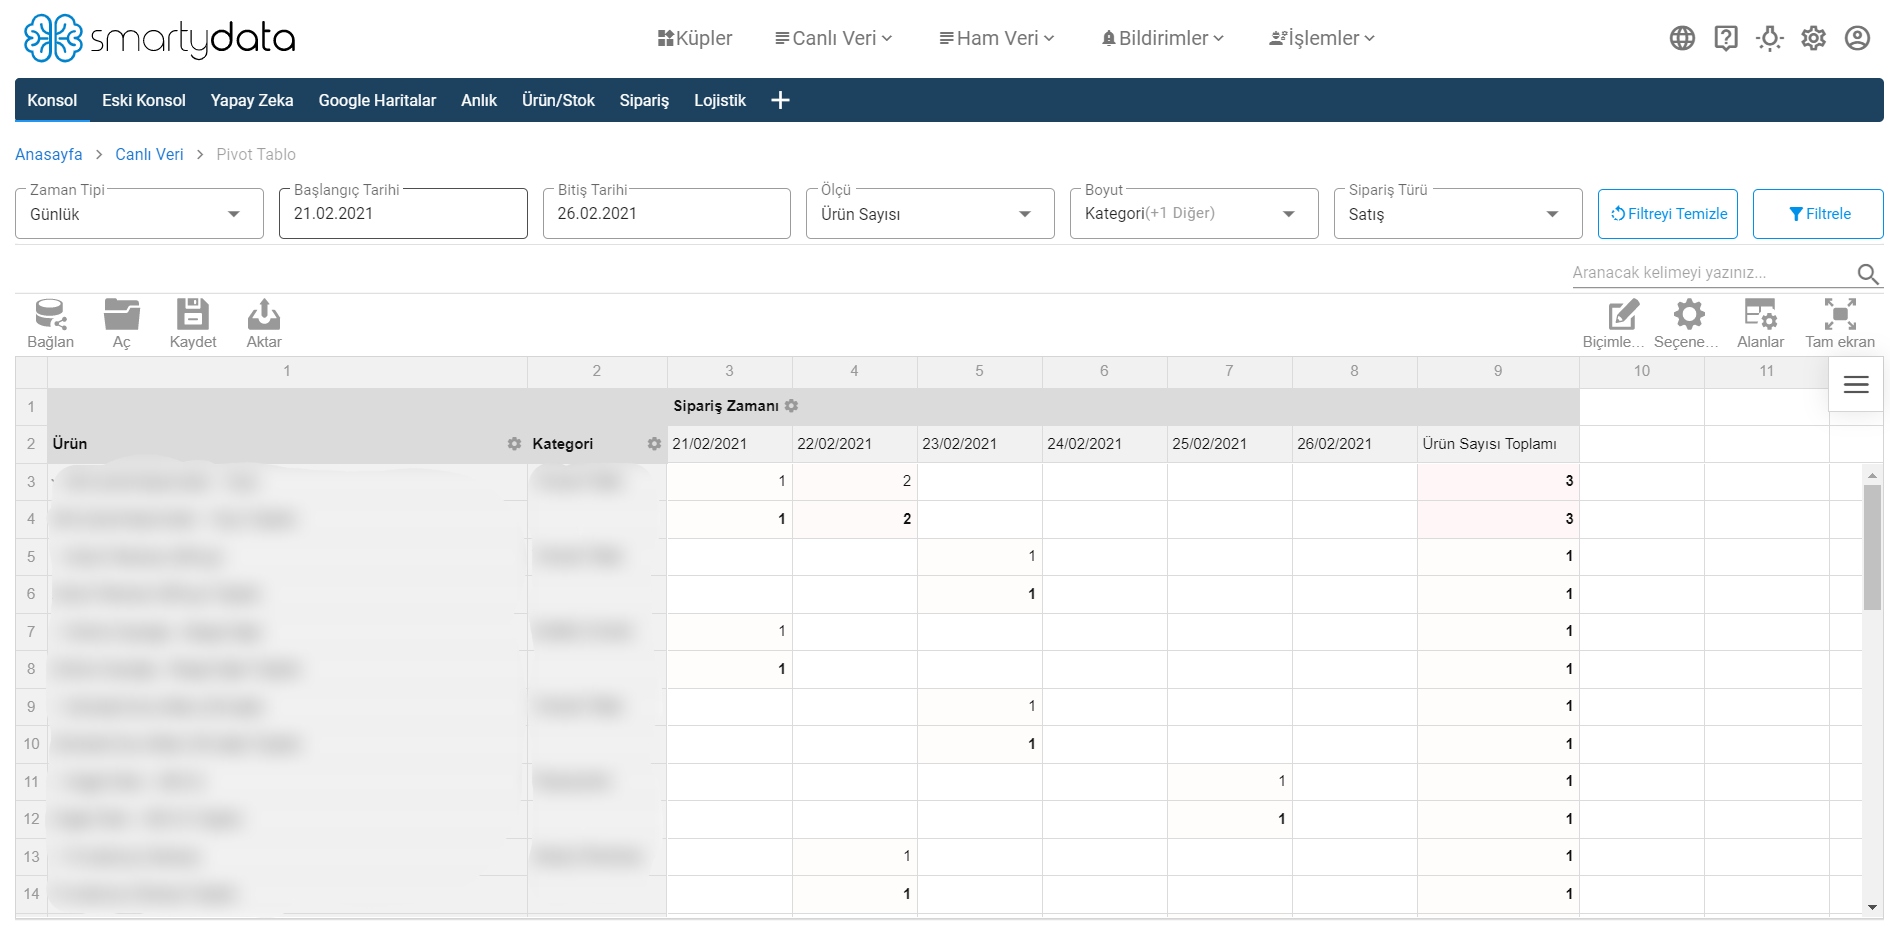
Time Type: Allows filtering by day or week.
Measure: Allows you to select multiple criteria to calculate.
Dimension: Allows you to select multiple dimensions to calculate.
Order Type: You can select your order type as sales, cancellations, or returns according to the order type filter.
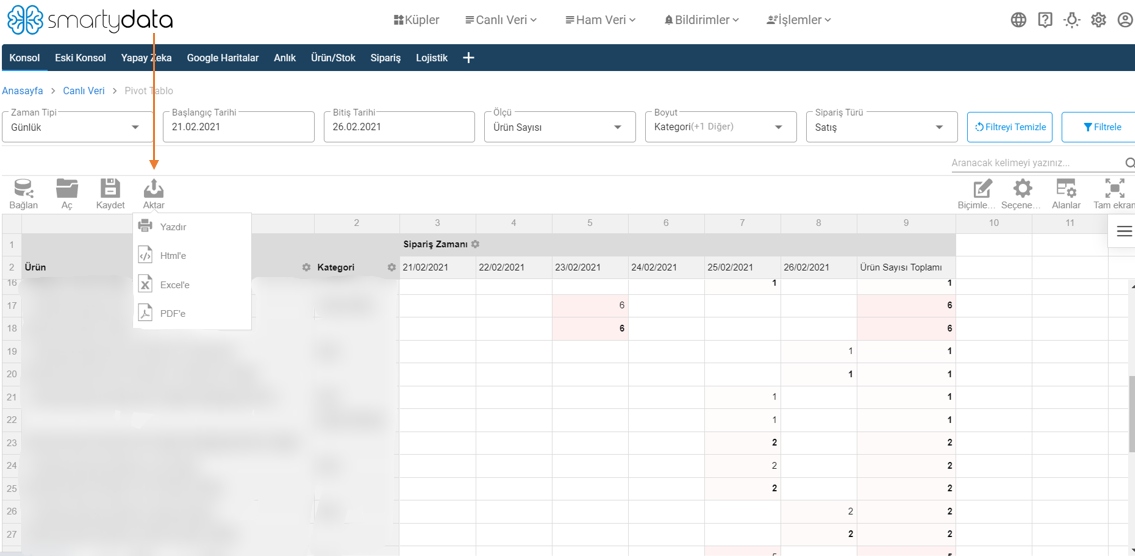
Export: Allows you to export and print your pivot table as HTML, Excel, or PDF.
Formatting: You can format your pivot table’s values and features using cell formatting and conditional formatting options.
Format Cells: Align and format the values inside the cells.
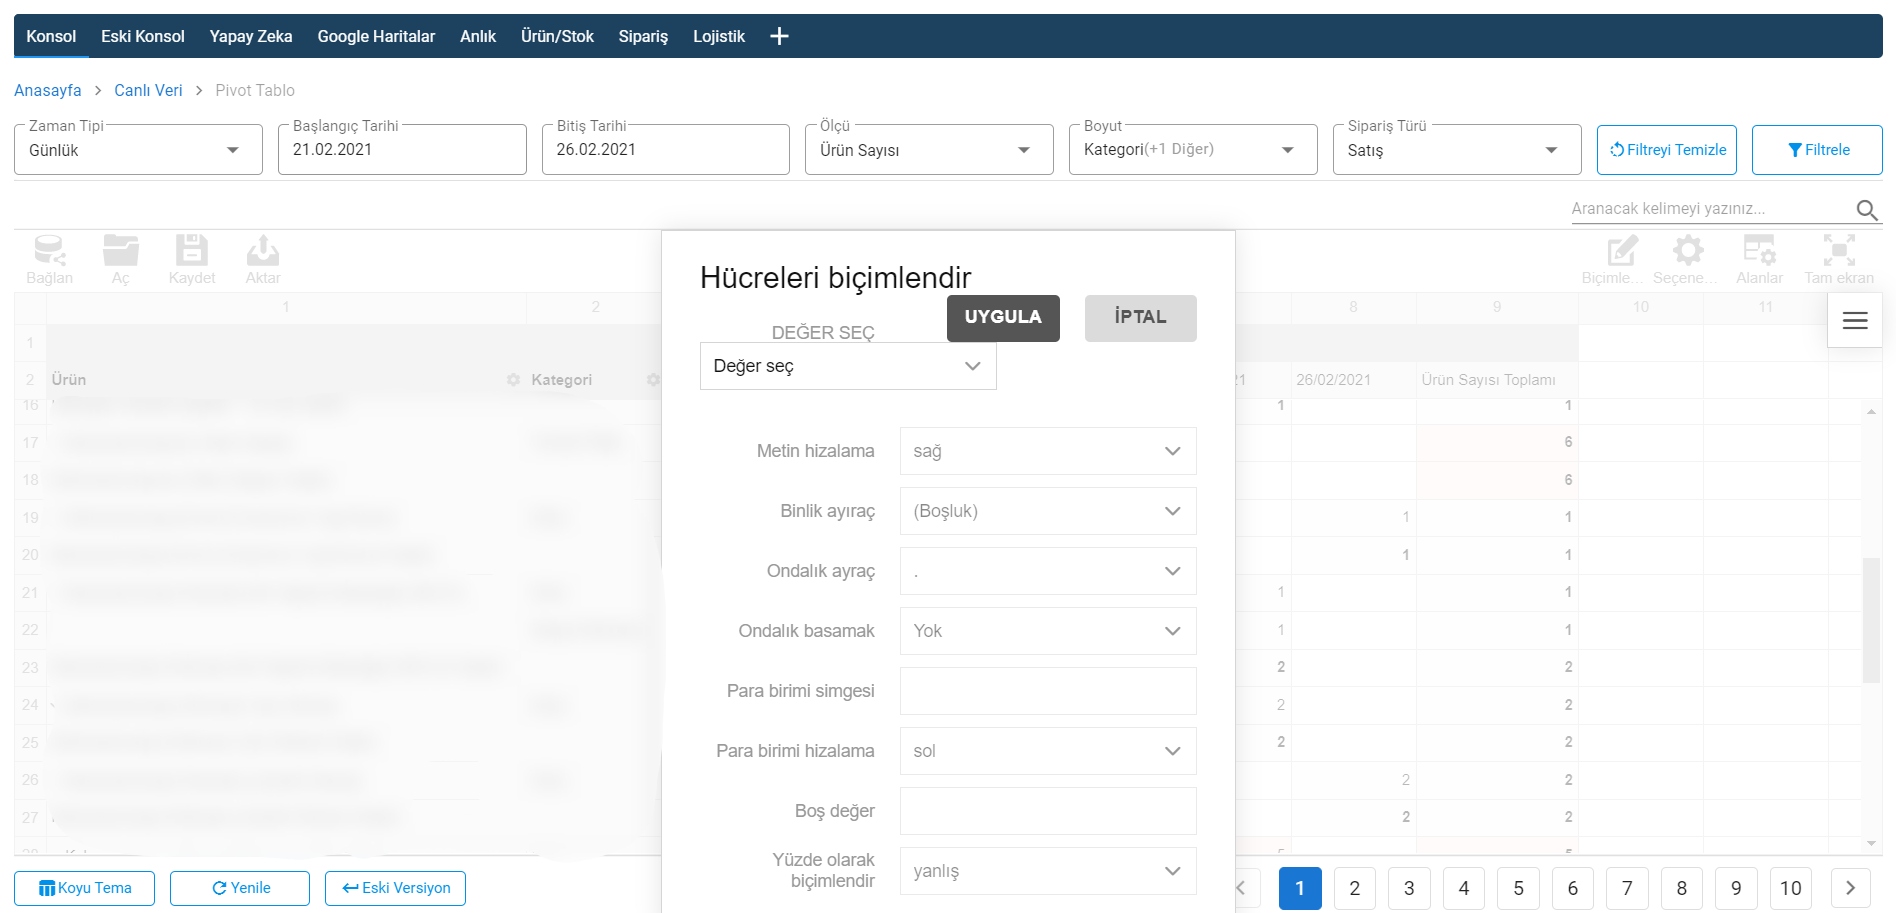
Select Values: Two options exist: ‘All Values’ applies filters to all data, while the other applies filters only to the selected measure.
Text Alignment: Filters to align text to the left or right.
Thousands Separator: Aligns and formats numbers with thousand separators.
Decimal Separator: Symbol that separates the integer part and fractional part of decimal numbers.
Decimal Places: Filter to select how many digits after the decimal point are displayed.
Currency Symbol: Filter to show the currency symbol alongside values in the table.
Currency Alignment: Filter to align currency symbols to the left or right.
Conditional Formatting: Helps you highlight cells or ranges, emphasize unusual values, and visualize data changes with data bars, color scales, and icon sets.
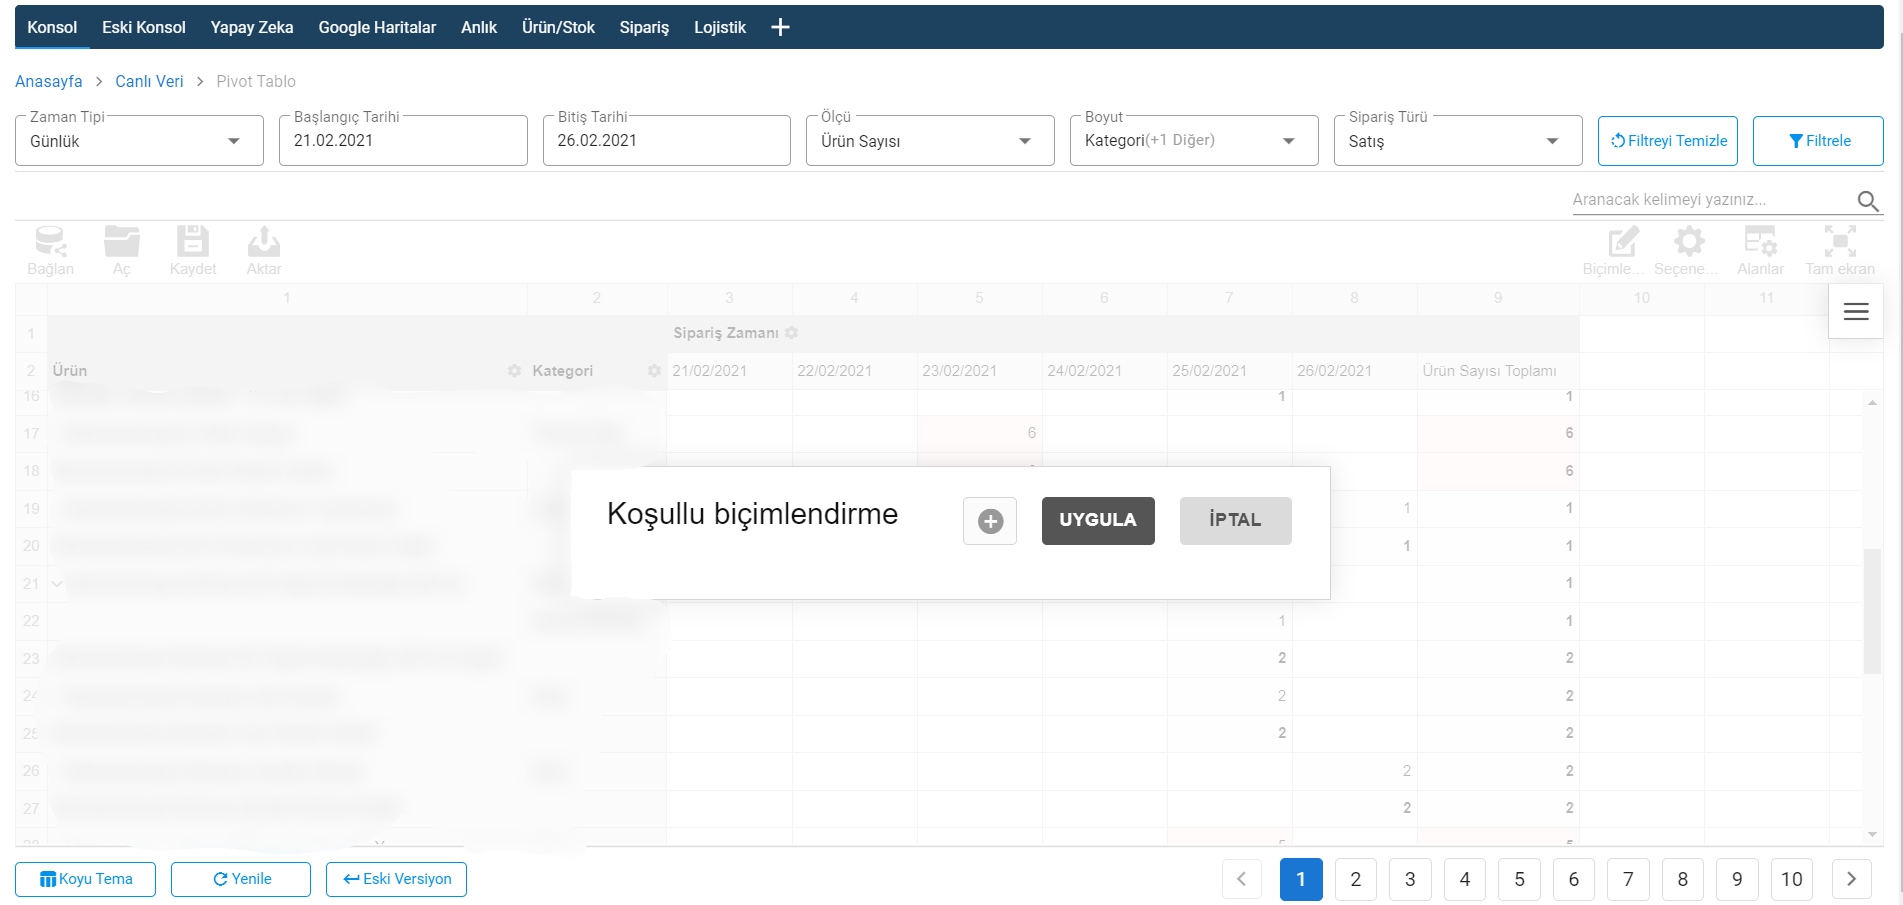
Click the plus button to start creating conditional formatting rules.
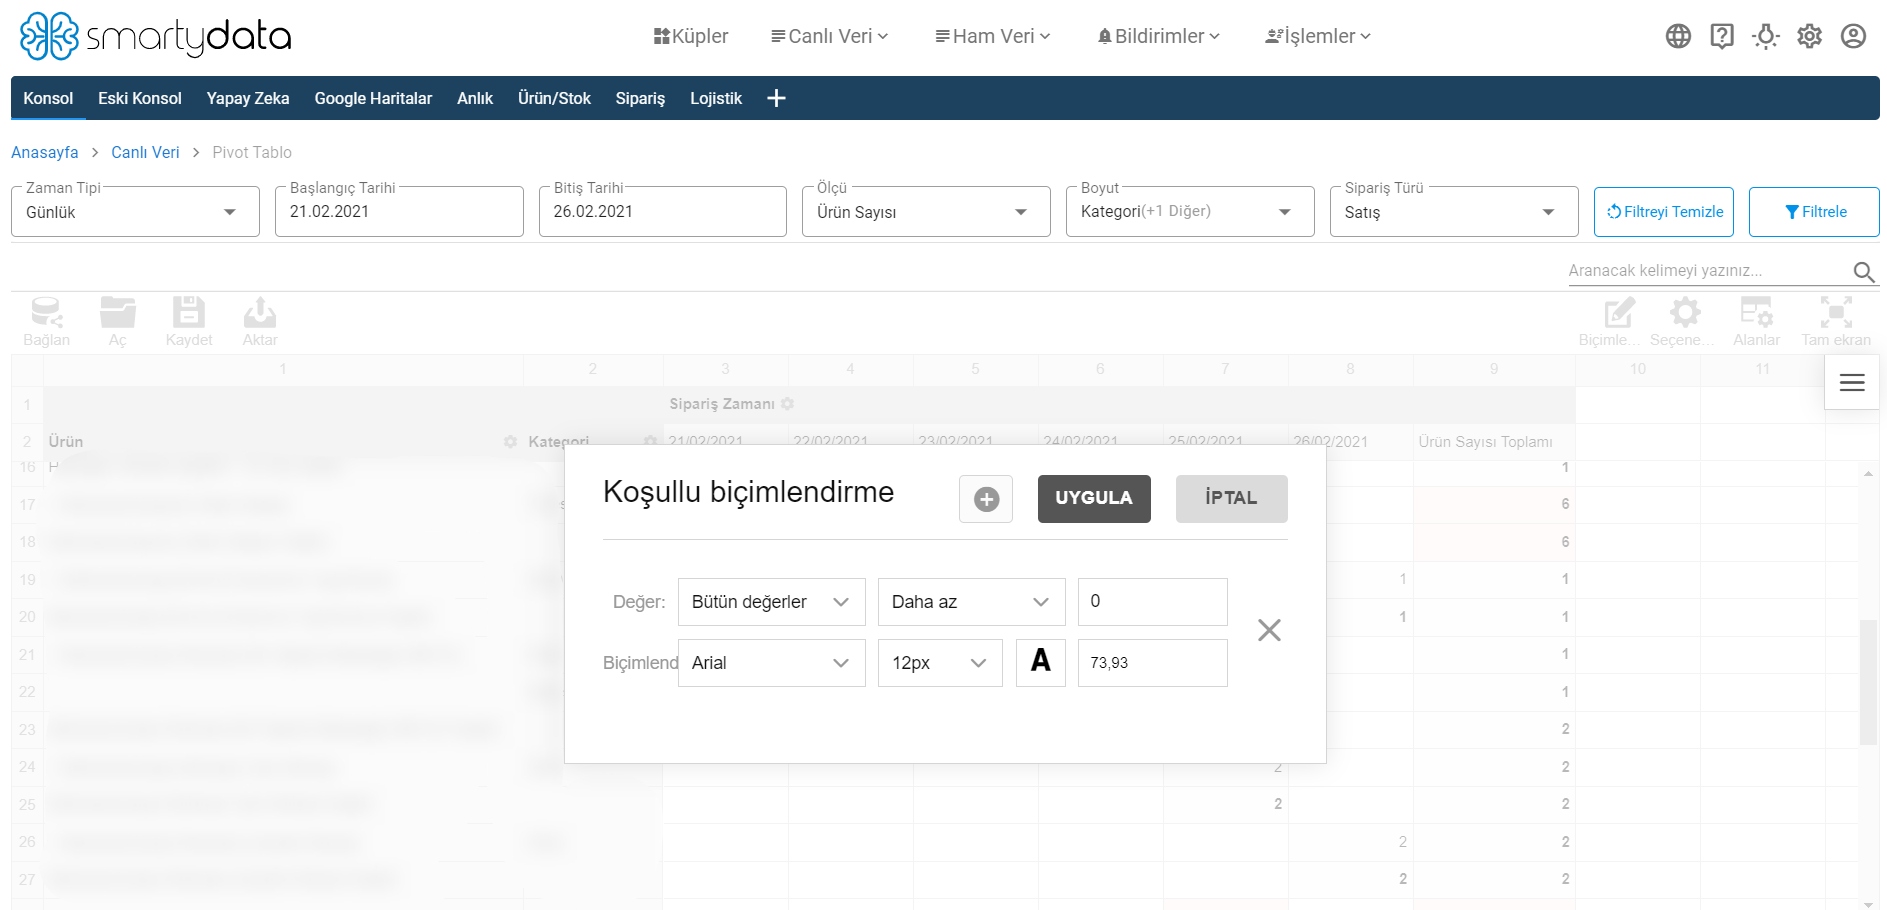
Value: In the value filter, you can filter and calculate based on all values or selected measures.
Less Than: Filters values less than the entered value.
Greater Than: Filters values greater than the entered value.
Greater Than or Equal To: Filters values equal to or greater than the entered value.
Equal To: Filters values equal to the entered value.
Not Equal To: Filters values not equal to the entered value.
Between: Filters values between two entered values.
Blank: Does not allow value entry.

Used for filtering and adjusting the table layout with grand totals, subtotals, and layout options.
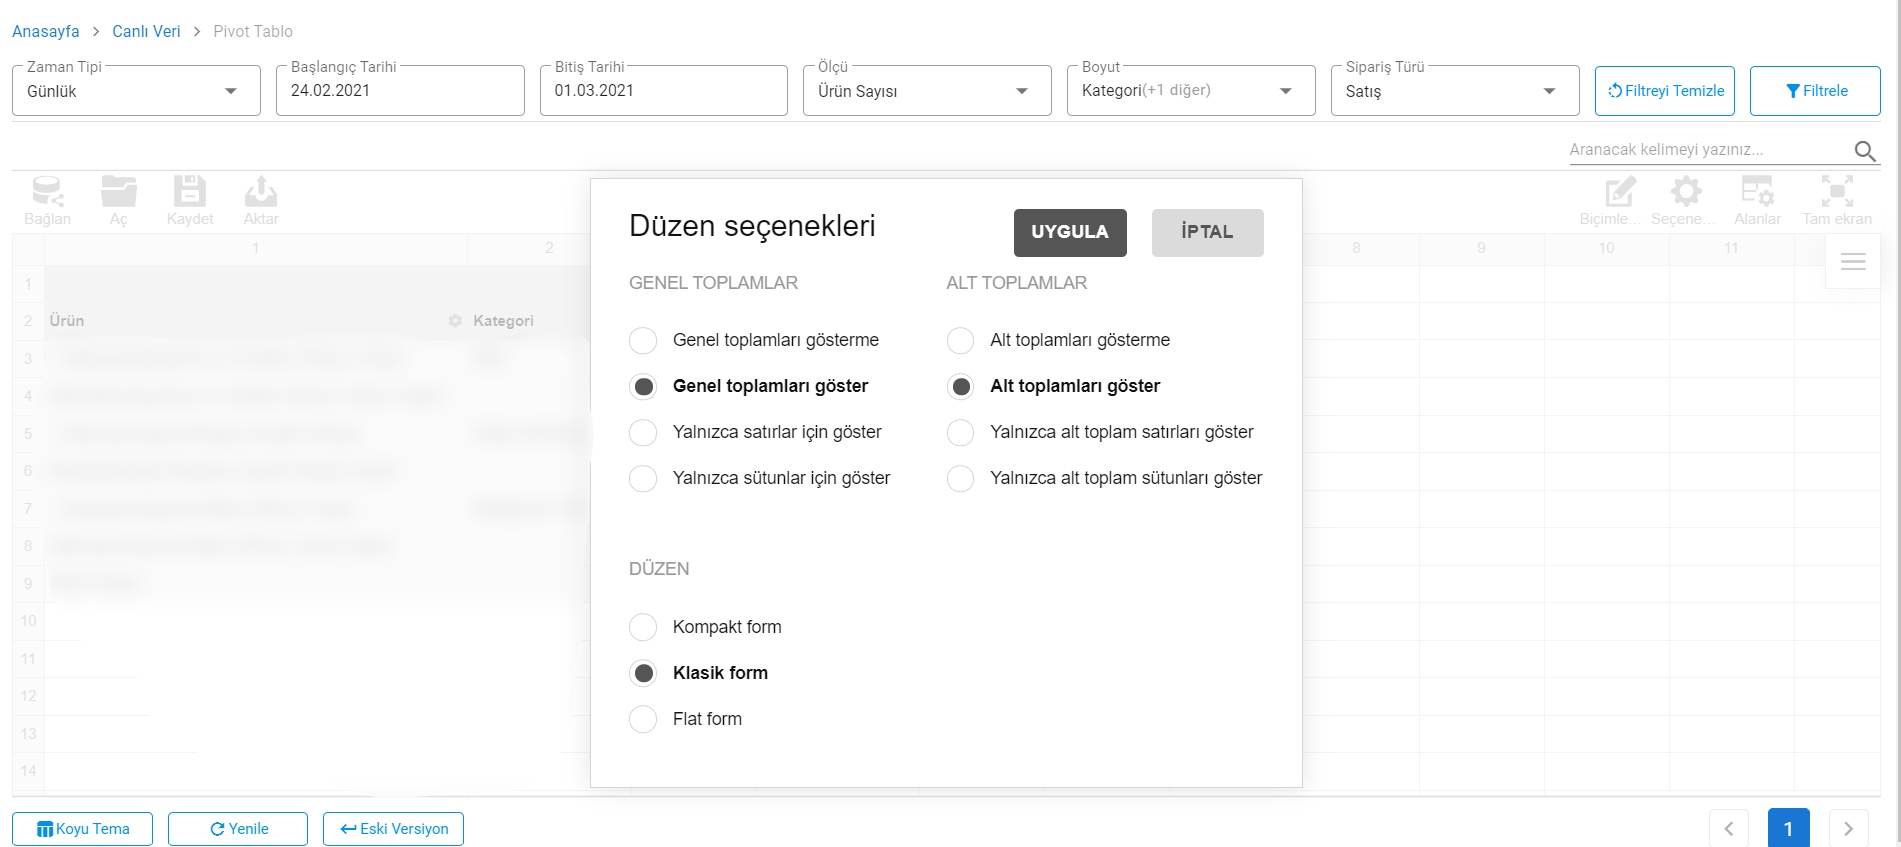
Show Grand Totals: Used to show the grand totals of your data.
Hide Grand Totals: Used to hide the grand totals of your data.
Show for Rows Only: Shows grand totals only for rows and hides totals for columns.
Show for Columns Only: Shows grand totals only for columns and hides totals for rows.
Show Subtotals: Shows subtotals for each category.
Hide Subtotals: Hides subtotals for each category.
Layout: You can display your table in compact, classic, or flat form layouts.
Fields: Allows drag-and-drop of table headers into rows or columns to create reports and filter fields.
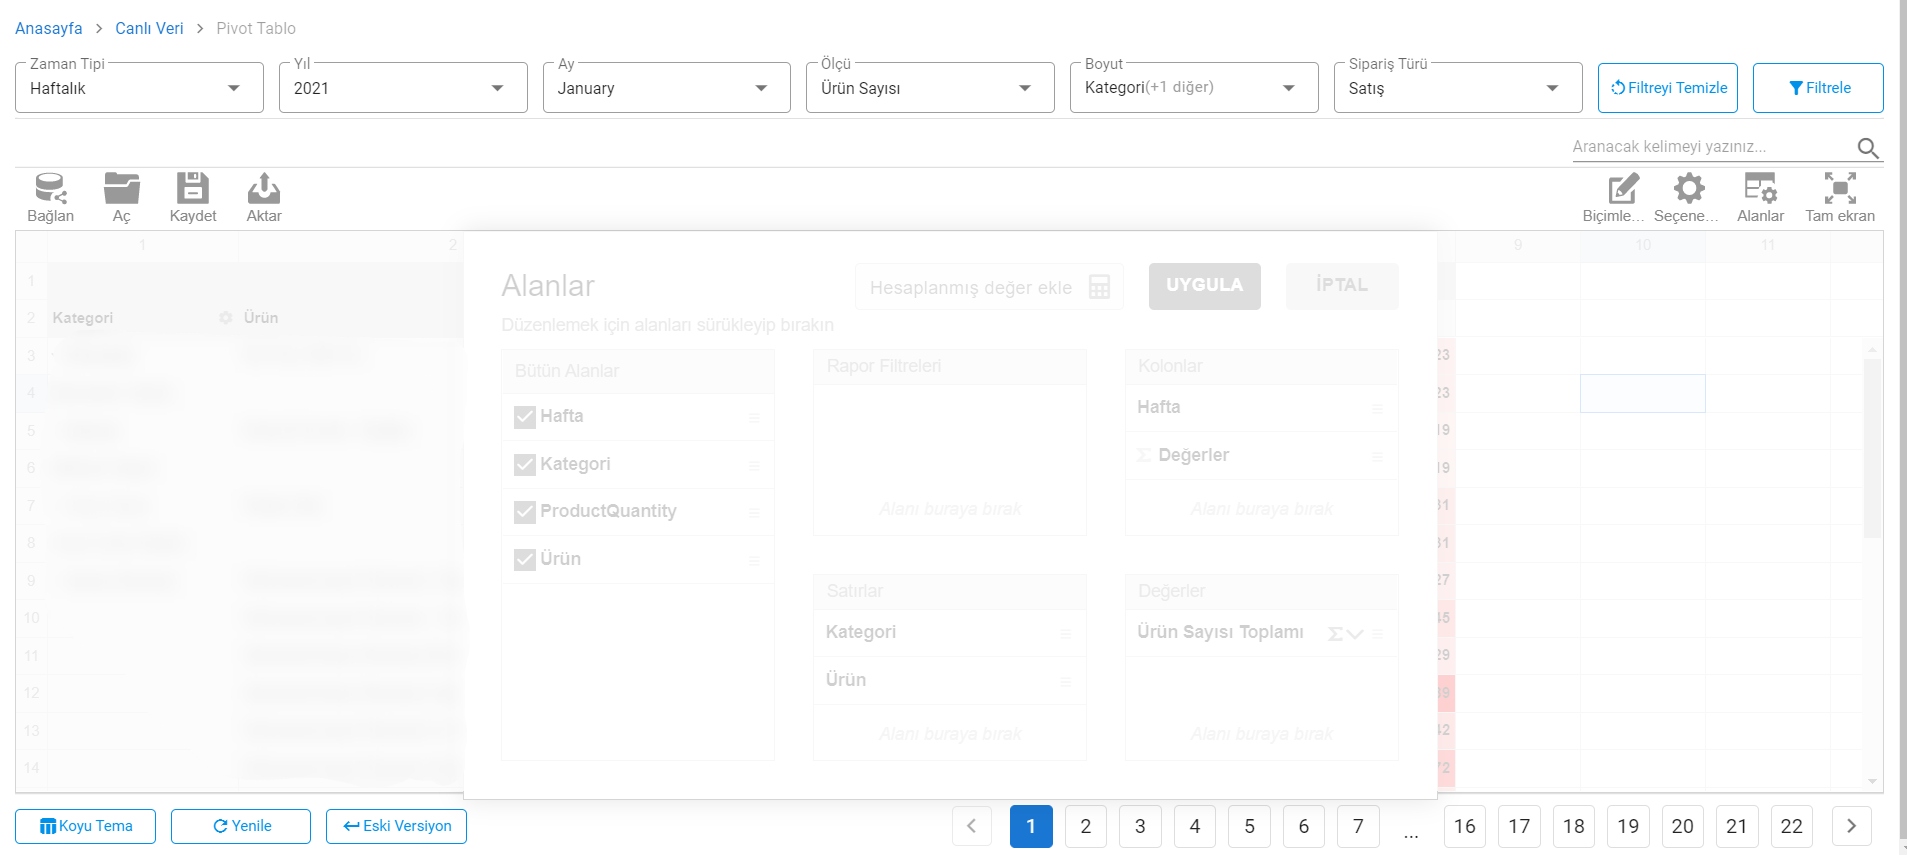
All Fields: Represents all selected field headers in your pivot table.
Report Filters: Allows you to drag and drop headers to the report filter area to create reports based on your chosen filters.
Rows: Specifies fields to be shown in rows of the pivot table.
Columns: Specifies fields to be shown as columns in the pivot table.
Values: The area where calculated values are displayed in your table.
Pivot Table 2
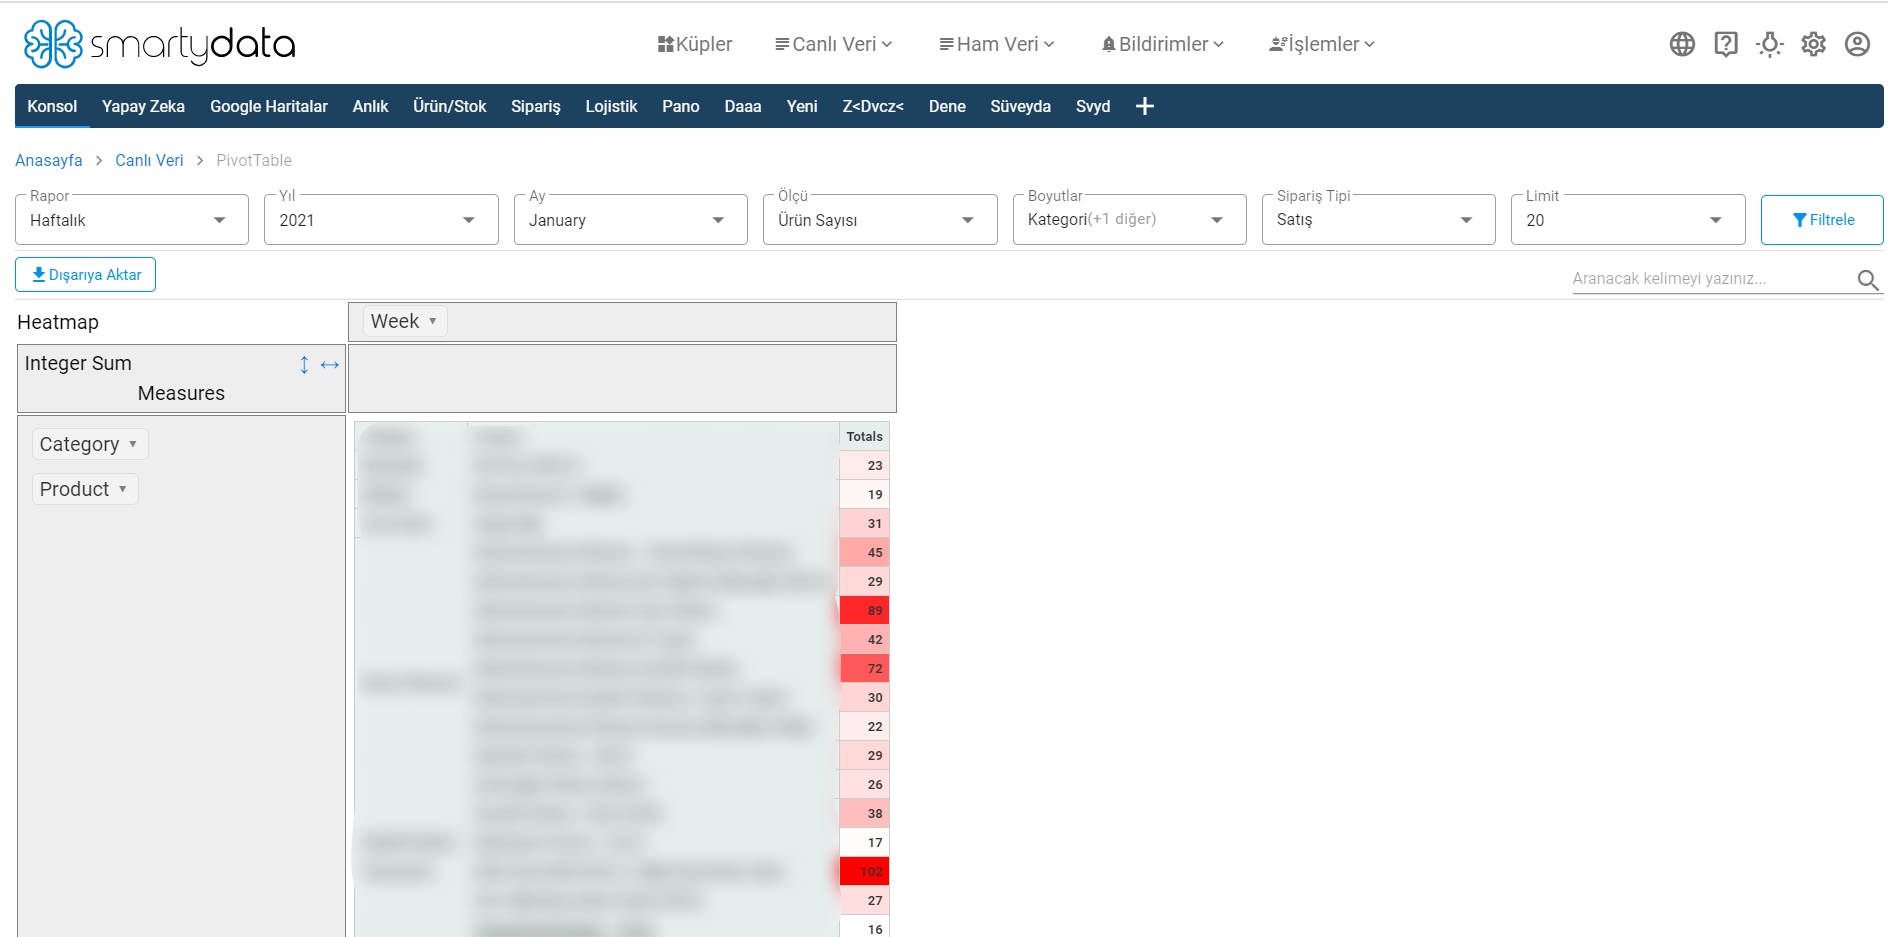
Time Type: Allows filtering by day or week.
Measure: Allows you to select multiple criteria to calculate.
Dimension: Allows you to select the dimension you want to calculate.
Order Type: You can select your order type as sales, cancellations, or returns according to the order type filter.
Heatmap: Option that visualizes your